User defined functions in pandas help you handle logic that built-in Pandas tools do not support. Real datasets from different industries follow rules that change from project to project, so you often need your own processing method. A UDF lets you write custom logic and apply it to a column or an entire row. This gives you full control over how each value is handled and allows you to solve problems that standard Pandas operations cannot cover.

What Is a User Defined Functions in Pandas?
A UDF is a normal Python function. You create it with def and then apply it to a column using apply. It returns a single value for each input value. Pandas passes values from the column to the UDF one by one. You decide the logic, the conditions, the mapping, and the final output. This makes UDFs perfect for tasks where the dataset needs processing that Pandas does not provide out of the box.
Example 1: Calculating Total Marks From Multiple Columns
Assume a CSV file score.csv contains marks for five subjects. You want the total score for each student. Pandas does not have a direct method for this exact CSV, so you sum the columns using iloc.
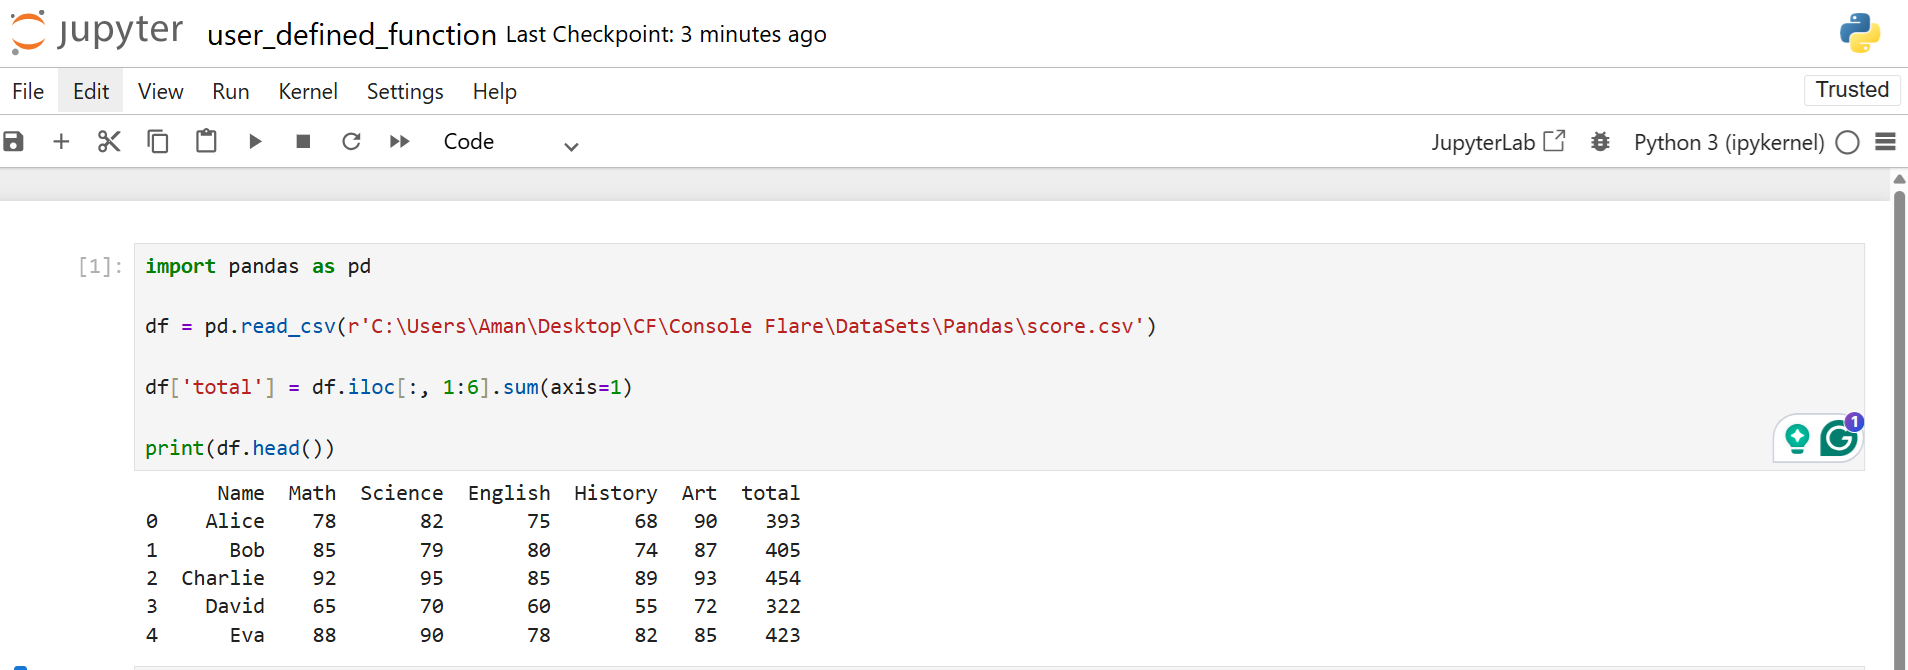
The code reads the CSV, selects columns from index 1 to 5, and sums them across each row. The new column totals the final score.
Example 2: Creating a Grade Column Using a UDF
Now you want to assign grades based on the total. The grading rule is custom, so you write a UDF.
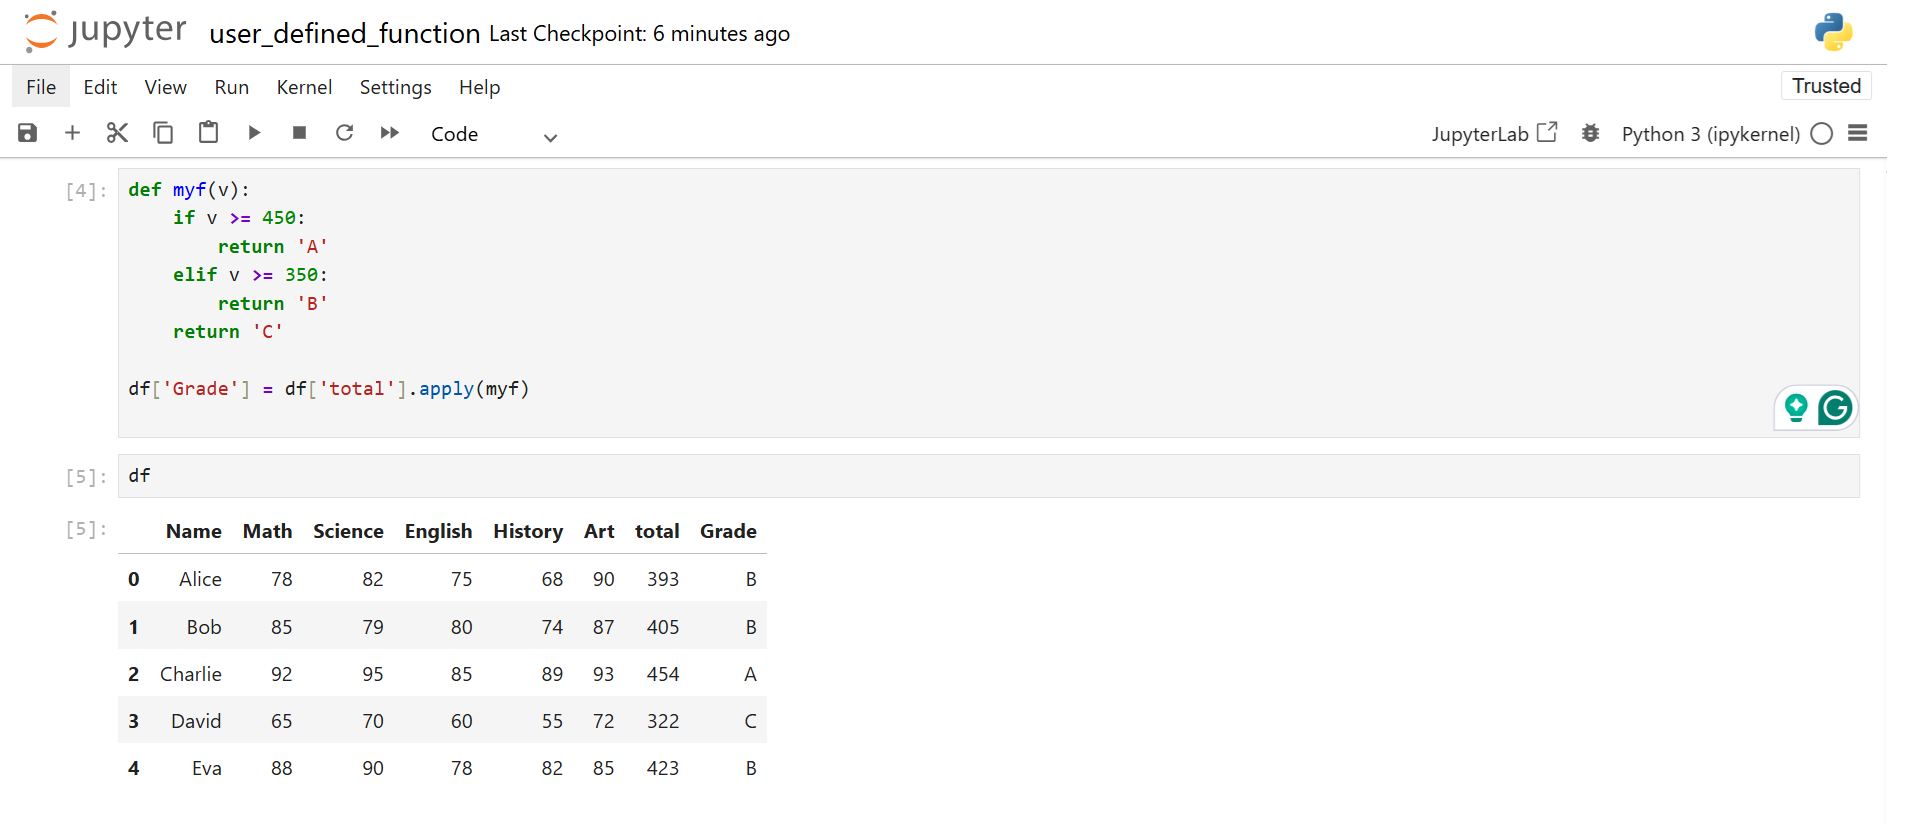
The UDF receives a single value at a time. If the value fits a condition, the function returns the grade. apply sends every score from the total column to the UDF and stores the output in Grade.
Use Case 1: Converting Calendar Quarter to Indian Financial Quarter
Companies in India follow a different quarter cycle. The year starts in April, not January. You need to convert normal quarters to Indian quarters.
The CSV expense.csv contains dates and expenses. You convert the date column to a datetime and extract the quarter.
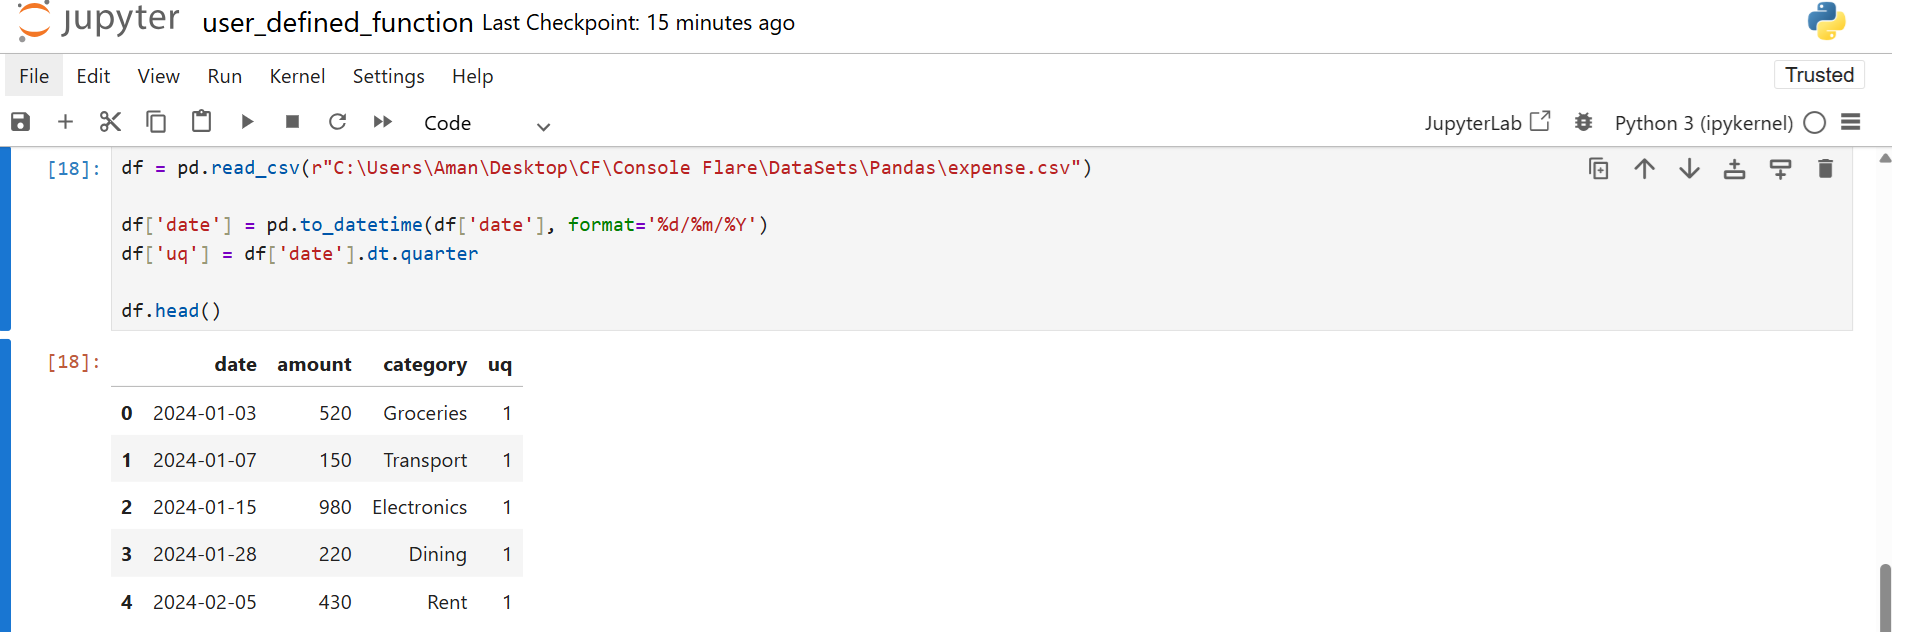
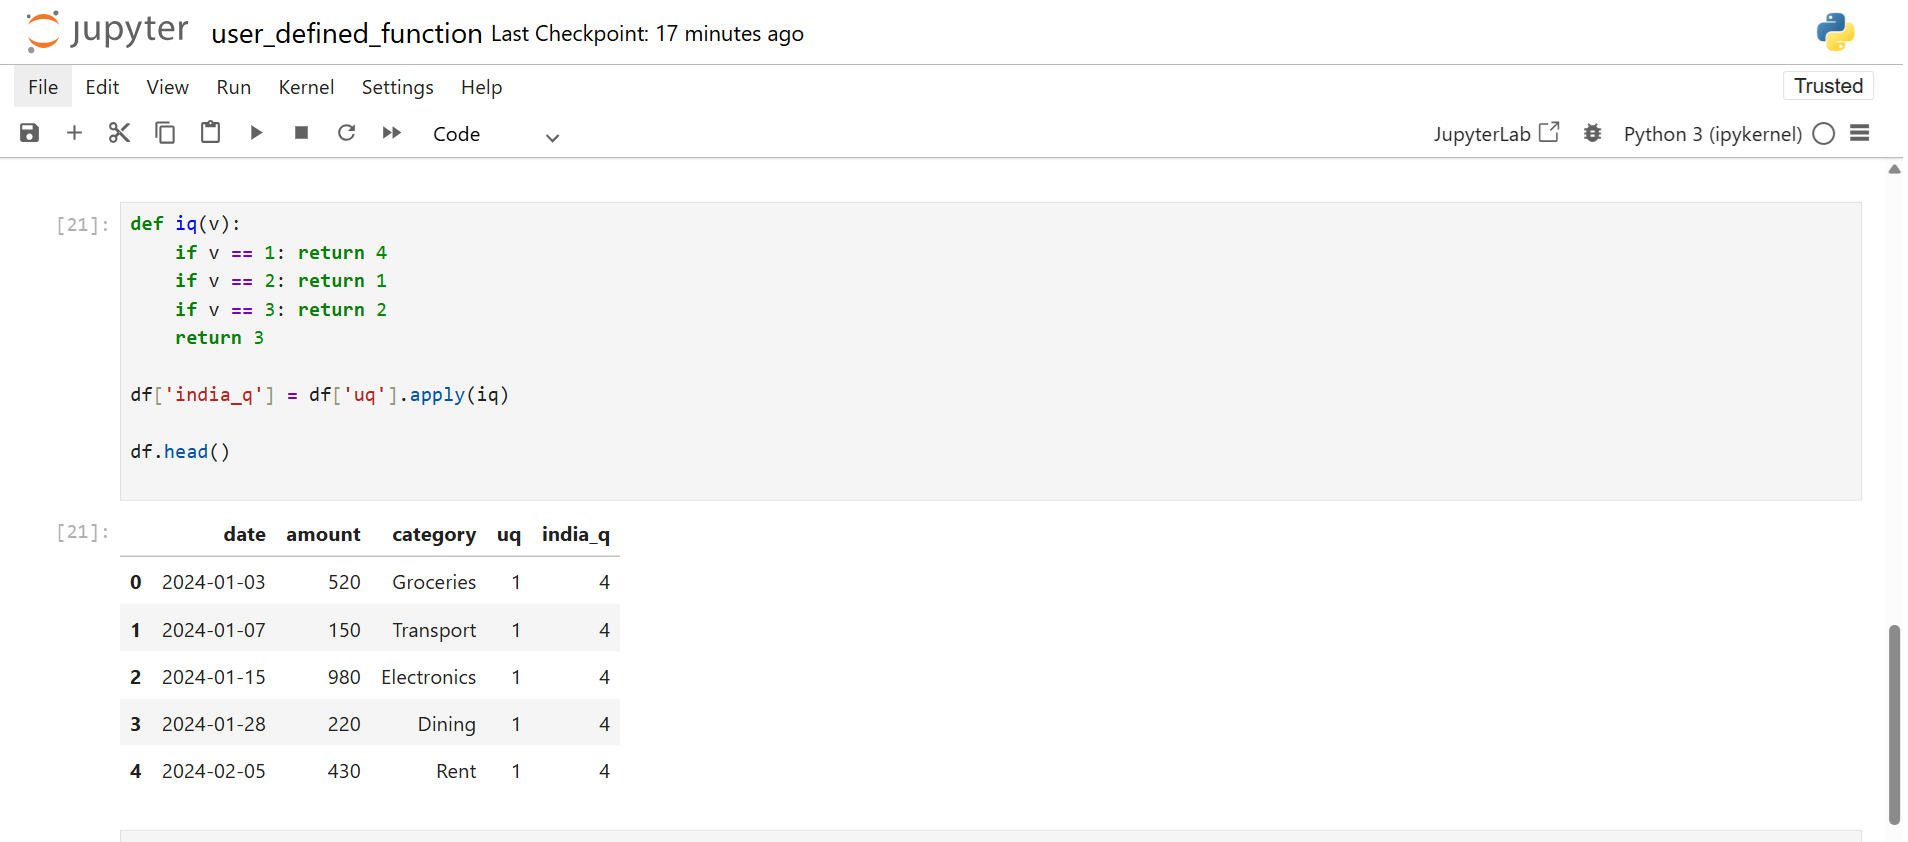
The extracted quarter is a standard quarter. You convert it into the Indian format using a UDF.
Indian mapping rules:
Quarter 2 becomes Q1
Quarter 3 becomes Q2
Quarter 4 becomes Q3
Quarter 1 becomes Q4
Once you have India_q, you compute which financial quarter had the highest expense.
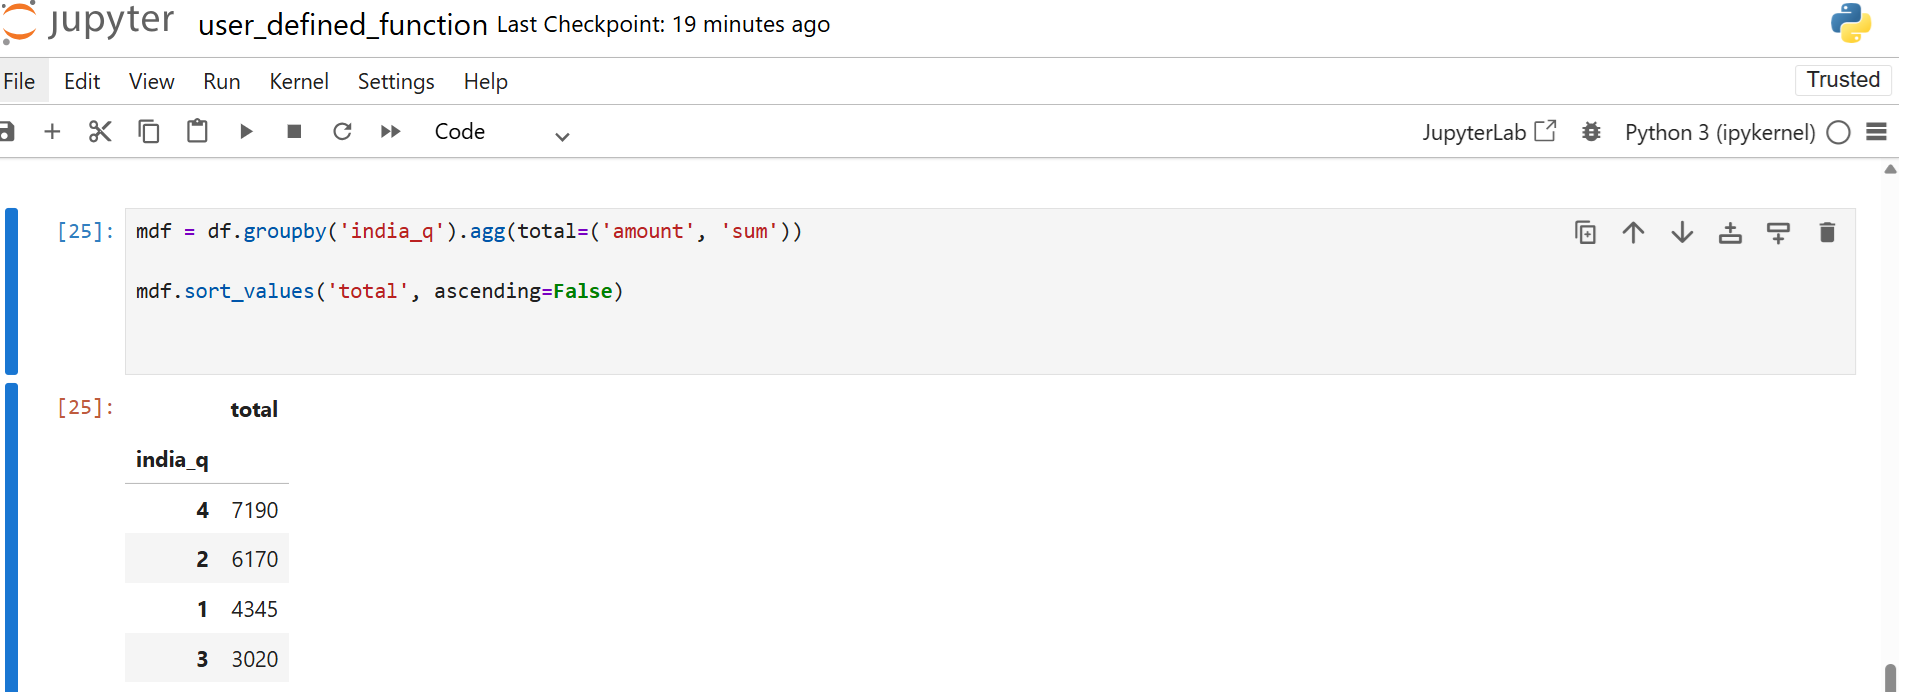
This gives a sorted view of the total spend in each quarter.
Use Case 2, Grouping Customers by Age Brackets
Question: Which age group purchases from us the most?
Load retail sales data:
df = pd.read_csv('retail_sales_dataset.csv')

df.head()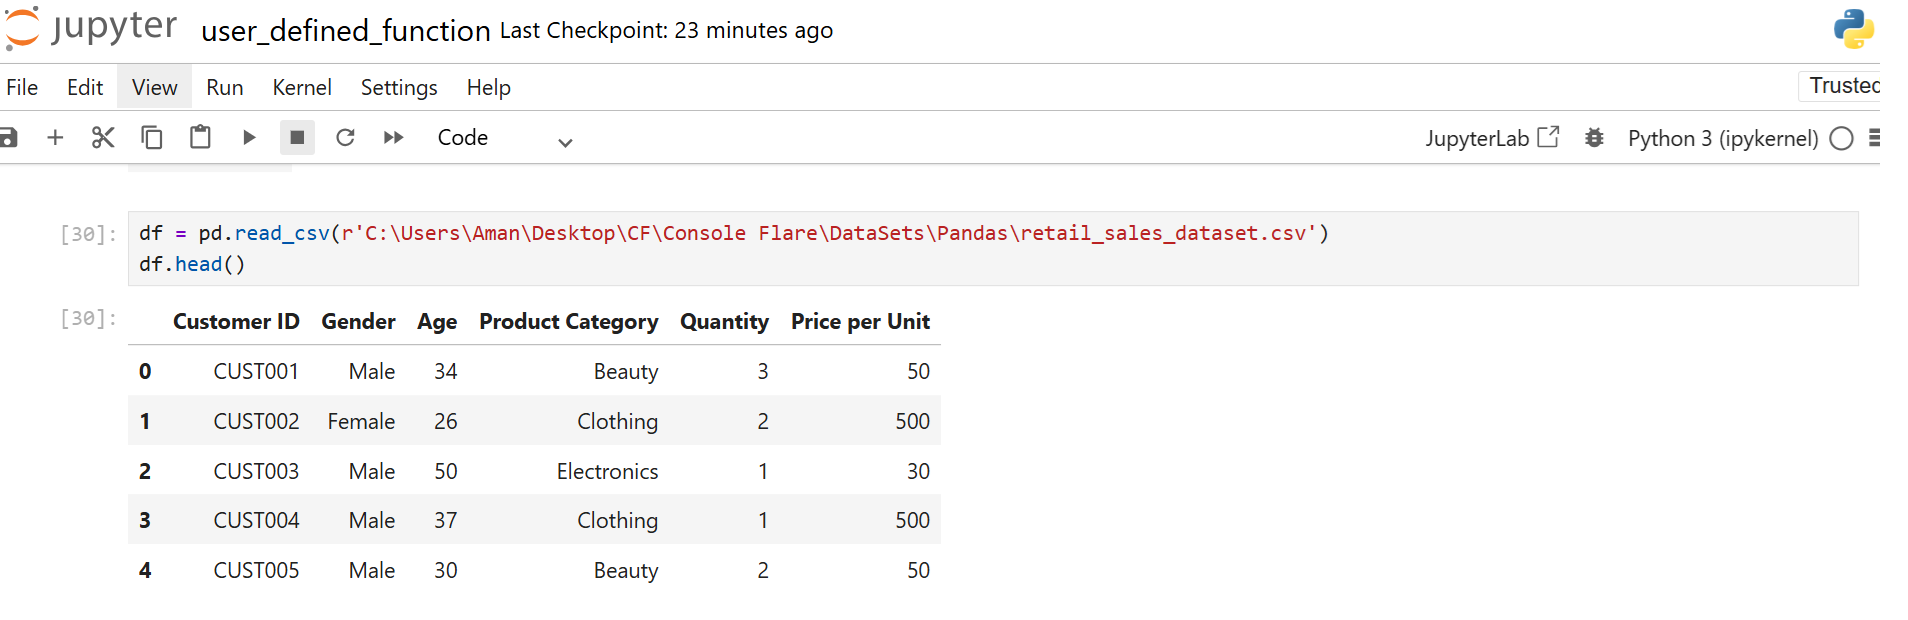
Creating age brackets is common in marketing and analytics. Instead of writing nested conditions each time, you create a UDF to convert any age into a group.

After converting the ages, you count how many fall into each bracket.
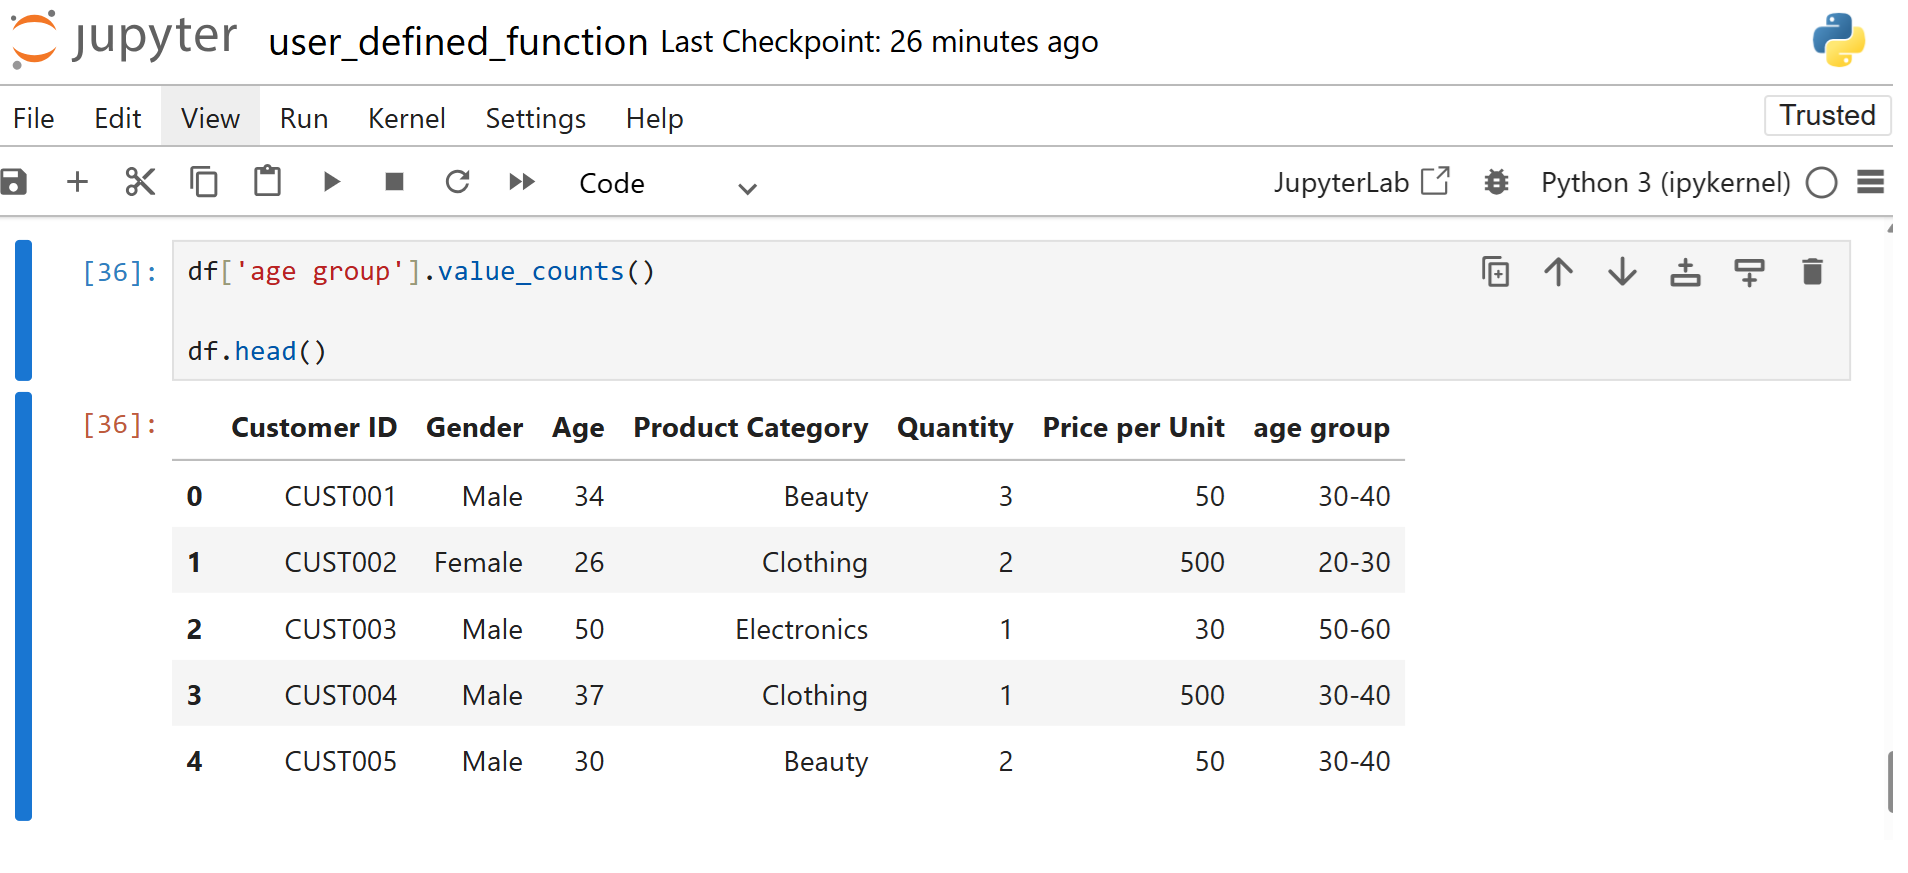
This gives a clear distribution of your customer base.
Using External Libraries Inside a UDF
Simple example of conversion with GoogleTranslator:
from deep_translator import GoogleTranslator

review = "this is good product."
translation = GoogleTranslator(source='auto', target='hi').translate(review)
print(translation)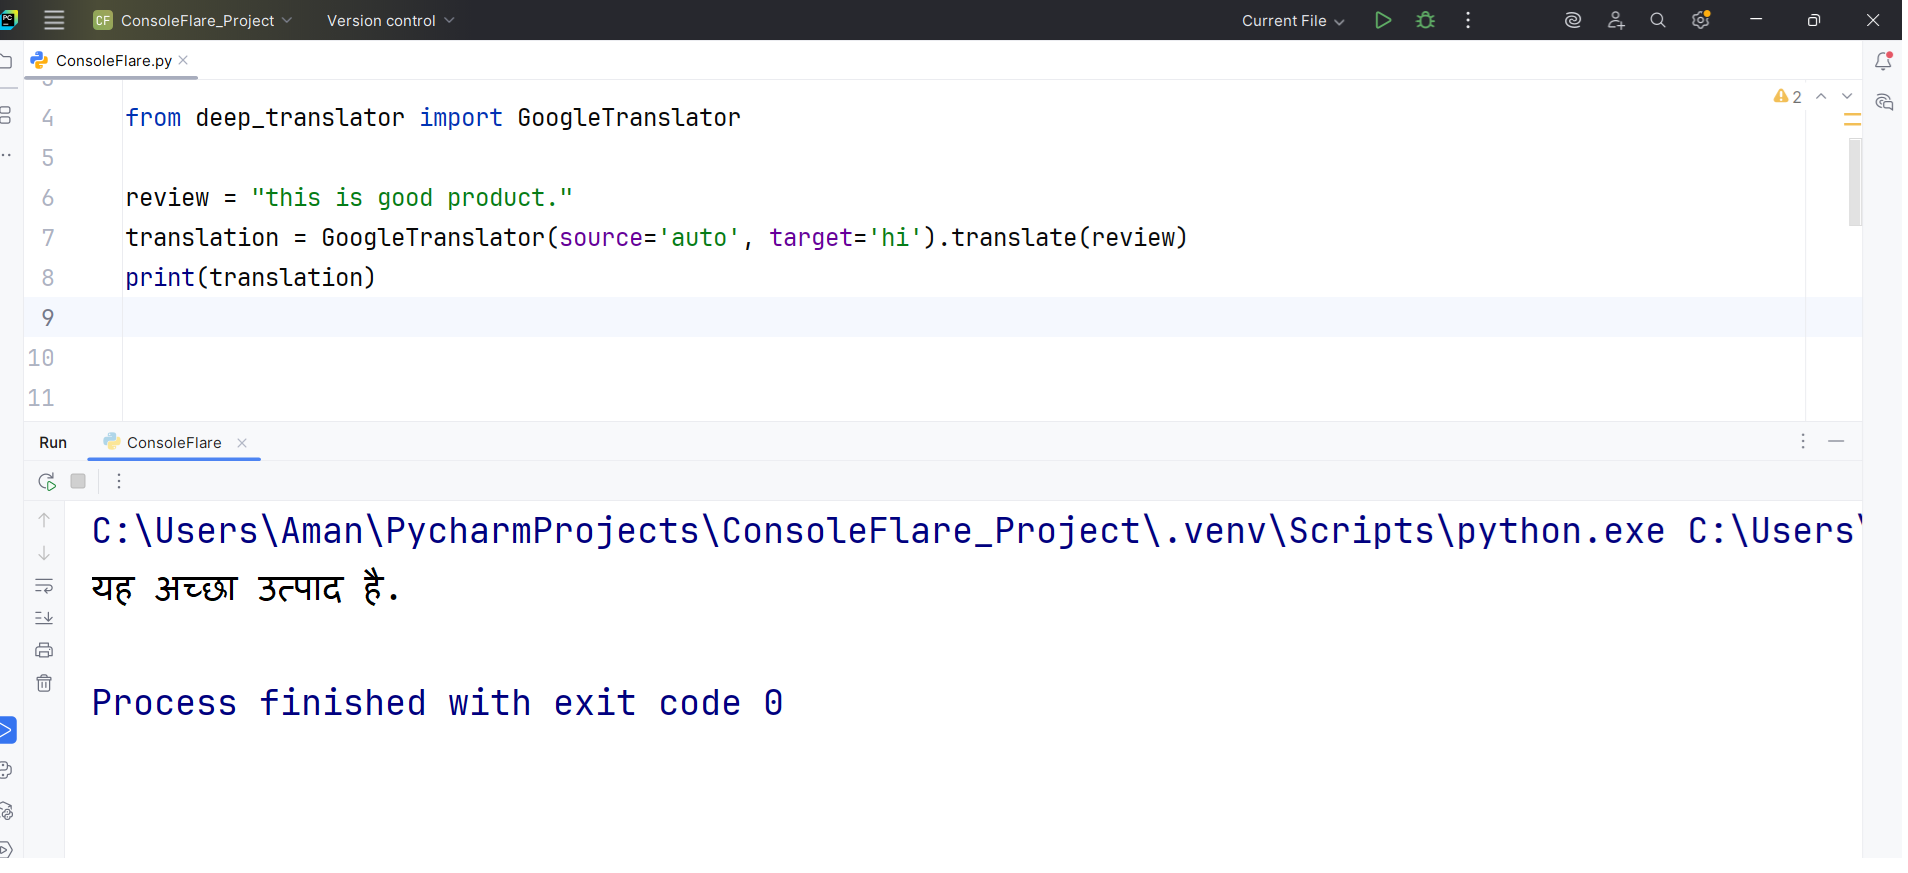
Translation Example
Sometimes you need to translate text from any language to English before analysis. The deep_translator library handles this cleanly. You place the translation inside a UDF because each row needs to be processed individually.
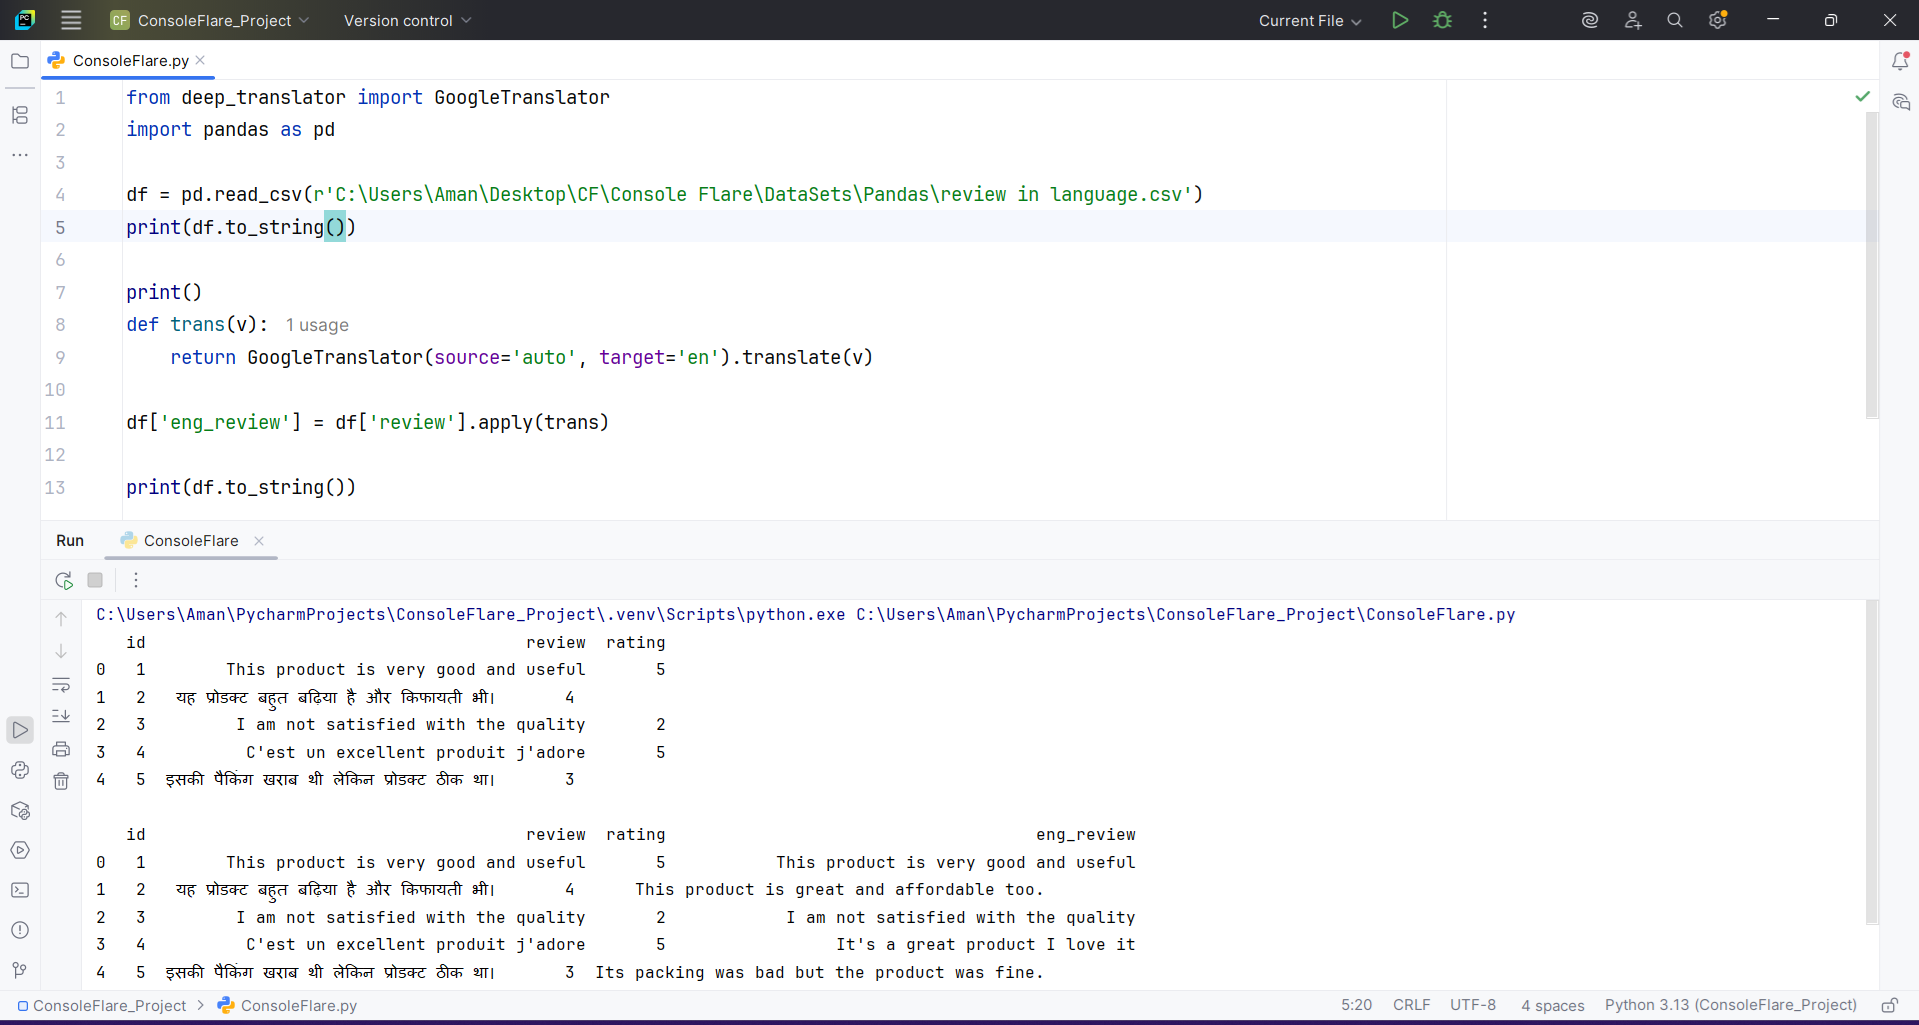
The UDF receives each review, translates it, and returns English text. The translated column becomes the base for further analysis.
Sentiment Score Using TextBlob UDF
For sentiment analysis, you can use TextBlob. It produces a polarity score between -1 and 1. Again, a UDF is perfect because each review must be processed separately.
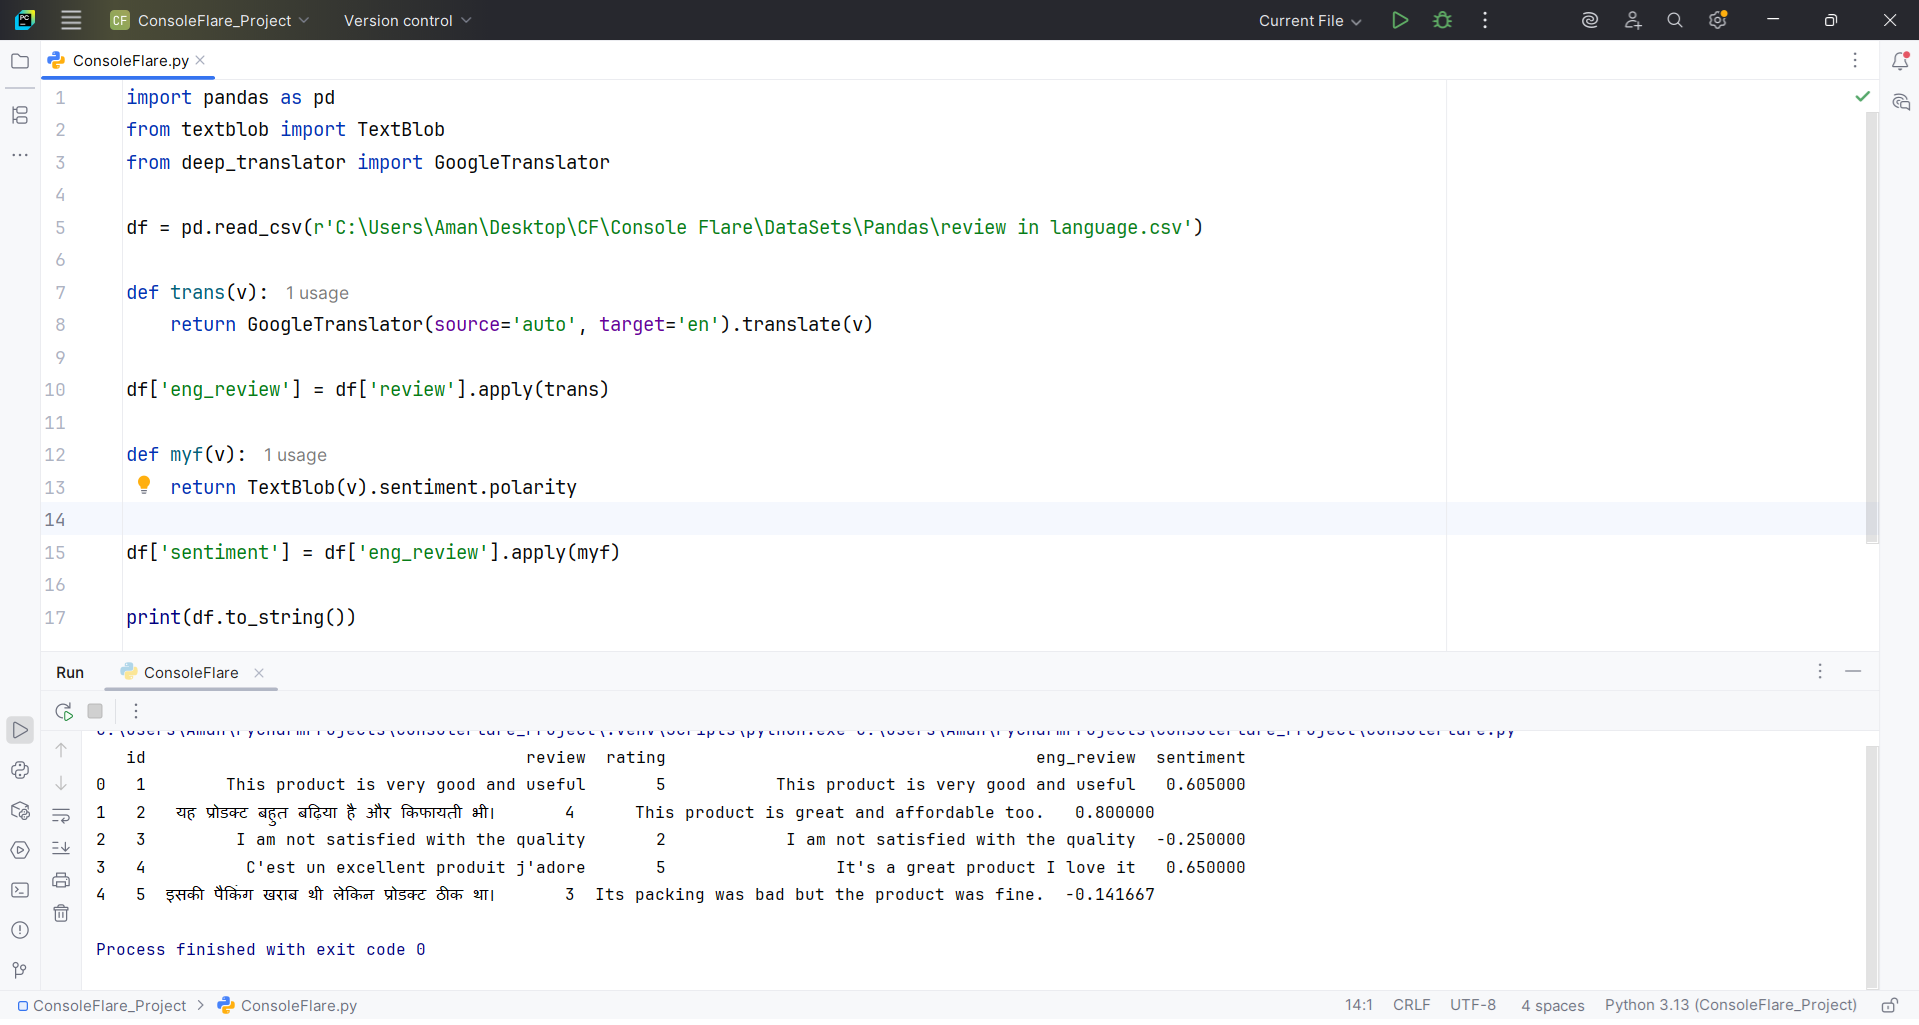
The output tells you whether the statement is negative, neutral, or positive.
Building Business Rules With UDFs
Categorizing Insurance Claims
Insurance claim descriptions come in free text. You build your own rule to classify claims into Theft, Natural Damage, Mechanical Issue, Collision, or Other.
Apply the rule to the claim description column.
This produces a structured category for each claim.
Passing Entire Row to a UDF
Calculating a Composite Risk Score
There are cases where you need multiple columns to compute one value. Examples include credit scoring, risk scoring, or pricing models. You need access to the full row, not a single column. In such cases, you use apply with axis=1.
Here is a risk scoring model that uses age, vehicle age, claim history, location, and past accidents.
Applying this function processes the dataframe row by row.