If you’ve been scrolling through course brochures and ads promising “Become a Data Analyst in 6 months,” you’ve probably wondered what actually happens inside those classes. Do they really teach you coding from scratch? Or do they jump straight into dashboards and charts?
I’ve seen many learners start this journey — some from technical backgrounds, others from fields like sales, HR, or even logistics. What surprises them most isn’t how tough the subject is, but how logical and practical it becomes when taught the right way.
So, let’s take a walk through what a typical data analysis course syllabus in Noida looks like — week by week — and what skills you actually build along the way.
Syllabus of a Data Analysis Course in Noida
Weeks 1–8: Get involved in Programming with Python
The first week is about two things — comfort and familiarity.
You’ll start with Python, the backbone of data analytics. Most learners come in thinking coding is scary, but by the first week, they’re already printing “Hello World” and experimenting with data types.
You’ll cover:
- Data types (integers, strings, lists, dictionaries)
- Loops and conditional statements
- User-defined functions
- File handling + OS Module
- Projects
By week eight, you’ll start implementing your Python knowledge to solve your real-life scenarios. It’s the stage where Python stops feeling like “code” and starts feeling like a tool.
Weeks 9–16: Working with Python Libraries — Numpy, Pandas, Matplotlib, Seaborn
This is where things are highly interesting.
You’ll move from basic syntax to real data work using Python libraries.
- NumPy helps you handle numbers efficiently.
- Pandas lets you clean, merge, and analyze data tables like a pro.
- Matplotlib and Seaborn let you create graphs that actually tell stories and contribute to decision-making.
At this stage, you’ll start to feel like a detective — chasing patterns inside messy Excel sheets. Maybe you’ll notice sales dip every quarter-end or find that a certain product consistently performs better in one region. That’s the fun of analytics — spotting what others miss.
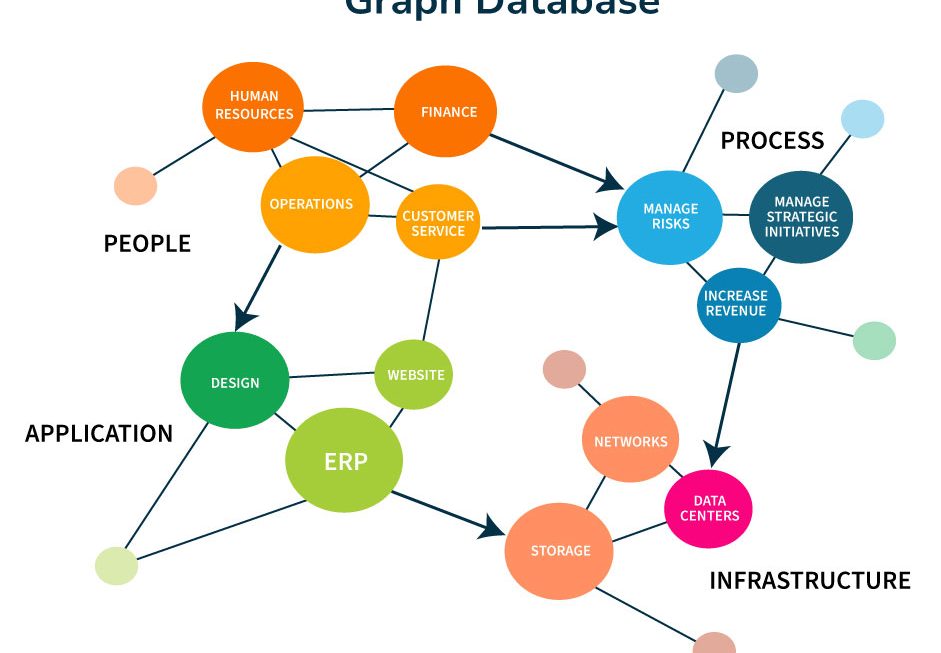
Weeks 17–20: SQL and Database Querying
Once you’re comfortable with data in Python, you’ll step into the world of SQL — the language that every database speaks.
Here, you’ll learn how to:
- Pull the right data from massive databases
- Join multiple tables using primary keys
- Use conditions, filters, and aggregations
- Apply window functions to perform advanced calculations
SQL gives you direct access to real company data — the kind stored in servers, not Excel sheets. And once you realize you can query millions of records with a single line, it’s an oddly satisfying feeling.
Weeks 21–24: Building Dashboards with Power BI
At this point, you’ve done enough backend work. Now comes the fun and front part — visualization through interactive dashboards.
You’ll learn Power BI, a tool that turns data into interactive dashboards. You’ll explore:
- Data modeling
- Creating visuals and charts
- Writing DAX queries for calculations
- Building complete dashboards that show performance metrics
If you’ve ever seen those fancy dashboards showing “Monthly Sales Growth” or “Customer Retention,” this is where you’ll learn to make them yourself. It’s also one of the most in-demand skills in analytics jobs today.
Weeks 25–29: Big Data Handling with PySpark and Databricks
Now the course shifts from spreadsheets to big data. You’ll get hands-on with PySpark and Databricks, tools designed for working with huge datasets — the kind that Excel would crash on. You’ll learn how to write optimization queries to process data faster and build pipelines that can handle millions of records smoothly. It’s not as scary as it sounds — once you understand the logic, it’s like building a more powerful version of the same analysis you’ve already been doing, just on a much larger scale.
Weeks 30–32: Machine Learning with Scikit-learn
This is where analytics start feeling futuristic.
You’ll dive into Scikit-learn, a Python library used for Machine Learning. Don’t worry — it’s not about becoming a data scientist overnight.
You’ll start with simple things like:
- Predicting future sales based on old data
- Classifying customers as “high-value” or “low-value”
- Using regression models that estimate outcomes
This part gives you a taste of how predictive analytics works — something employers love to see on a resume.
Weeks 33–34: Data Engineering + Final Capstone Project
By the final phase, everything comes together.
You’ll use Azure Data Factory (ADF) to create an automated data pipeline — pulling raw data, cleaning it using Medallion Architecture, transforming it, and pushing it into a visualization tool. Your capstone project might include all the tools you’ve learned — Python, SQL, Power BI, PySpark, and even a touch of machine learning. This project usually becomes the centerpiece of your portfolio — the one you showcase in interviews when someone asks, “Can you show me something you’ve built?”
What Makes Noida a Smart Choice for Learning Data Analytics?
Here’s a practical reason: location matters.
Noida has turned into a mini tech hub with analytics startups, IT firms, and global consultancies hiring fresh analysts every month. That means your trainers are often industry professionals, and your projects align closely with real business use cases.
I’ve seen people switch careers — from finance, marketing, or operations — to data analytics within six months of joining a good course in Noida. The mix of affordable training and placement connections really works in favor of learners here.
Final Thoughts
A good Data Analysis Course in Noida is more than just a checklist of tools. It’s a journey — one that starts with curiosity and ends with confidence.
You begin by learning how to code, and somewhere along the way, you start thinking like an analyst. You stop guessing and start proving. You stop assuming and start measuring.
And that’s what makes this field so rewarding — it’s not about memorizing formulas; it’s about finding stories hidden inside numbers.
Here is what you need to do now,
If you’ve been curious about analytics but never took the first step, now’s the time.
Explore a Data Analysis Course in Noida that blends theory with hands-on projects. Once you start seeing data differently, there’s no turning back — every number starts to tell a story.
For more such content and regular updates, follow us on Facebook, Instagram, and LinkedIn