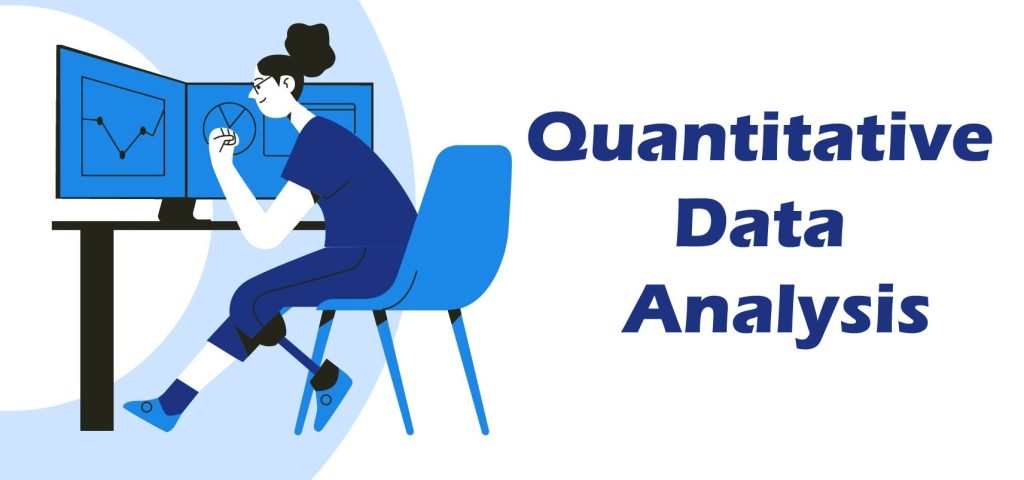
In today’s data-driven world, numbers speak louder than words. Whether you’re tracking your daily steps, analyzing your monthly expenses, or making big business decisions, numbers help you understand what’s really happening. That’s where Quantitative Data Analysis comes into play.
This blog will walk you through everything you need to know about quantitative analysis—even if you’re not from a technical background. Let’s make sense of numbers, one concept at a time.
What is Quantitative Data Analysis?
Quantitative data analysis is the process of examining numerical information using statistical and mathematical techniques. It’s all about answering questions like:
- How many?
- How much?
- How often?
For example, analyzing survey responses, test scores, sales data, or even app usage—all falls under this category.
In simple terms: You collect numbers, clean them, analyze them, and draw meaningful conclusions.
Why Does It Matter?
Quantitative analysis helps you:
- Identify patterns
- Understand relationships between things
- Make accurate predictions
Let’s say you want to know why sales are low in June. Analyzing monthly sales data can reveal trends and help you make better decisions.
Think of it as checking your exam scores to see where you improved and where you didn’t.
Types of Quantitative Data (Explained Simply)
There are two main types:
1. Discrete Data
This includes countable values.
Examples: Number of students in a class, number of cars in a parking lot.
2. Continuous Data
This includes values that can be measured and can have decimals.
Examples: Height, temperature, time.
Tip: If you can count it = discrete. If you can measure it = continuous.
Where Does This Data Come From?
You can gather quantitative data from:
- Online surveys and questionnaires
- Government census data
- Health or academic records
- Website and app usage
- Social media metrics (likes, comments, views)
In short: Anything that gives you a number can be a source of quantitative data.
How Do You Collect This Data?
Getting good results starts with collecting good data. Here are a few common methods:
- Structured surveys with fixed answer choices
- Sensors or lab instruments
- Logs from websites or banking systems
Simple rule: The more accurate the data, the better the analysis.
Tools You Can Use (Even as a Beginner)
You don’t have to be a data scientist to start analyzing data. Some beginner- and expert-friendly tools include:
- Microsoft Excel: Great for basic analysis and easy to learn
- SPSS/SAS: Ideal for advanced statistical tests and research
- Python: Perfect for data manipulation and automation
- Power BI: For building visual dashboards and presenting data
Pro tip: Start with Excel, then move to tools like Python or Power BI as you grow.
Clean Before You Analyze
Raw data is rarely perfect. It might have:
- Missing values
- Duplicate entries
- Wrong formats
Data cleaning means fixing these issues before analysis.
Think of it like washing vegetables before cooking. You’ll get better results!
Descriptive Statistics – Your First Look at Data
Once your data is ready, you can summarize it using:
- Mean (average)
- Median (middle value)
- Mode (most frequent value)
- Standard Deviation (how spread out your data is)
These give you a quick understanding of what’s going on in your dataset.
Understanding Correlation vs. Causation
People often confuse these two terms:
- Correlation: Two things are related (e.g., study time and grades go up together)
- Causation: One thing causes another (e.g., drinking more water directly improves hydration)
Key Point: Just because two things move together doesn’t mean one causes the other.
What Is Regression Analysis?
Regression helps you predict future outcomes and understand relationships. For example:
- Will increasing the price of a product reduce sales?
- Can you forecast next month’s revenue?
It’s a powerful tool for planning and strategy.
Visualizing Your Data (Because Charts Are Easier Than Tables)
Graphs and charts make data easier to understand. Some popular ones:
- Bar Charts / Line Graphs: Show changes over time
- Pie Charts: Show parts of a whole
- Scatter Plots: Show relationships between two things
- Heatmaps: Show patterns across many variables
Bottom line: People remember visuals better than raw numbers.
How Businesses Use Quantitative Analysis
Quantitative data is used in almost every industry:
- Marketing: To understand customer behavior and product demand
- Finance: For budgeting and risk analysis
- Retail: For stock management and pricing decisions
Even startups use it to track user growth and optimize ad campaigns.
Benefits of Quantitative Analysis
Here’s why it’s so valuable:
- Objective: Based on numbers, not guesses
- Repeatable: You can run the same analysis again to check results
- Scalable: Works for small or massive datasets
- Precise: Detects even small changes or unusual patterns
This is why it’s trusted in science, business, and research.
But It’s Not Always Easy – Common Challenges
Even though it’s powerful, there are some challenges:
- Bad data = bad results
- Biased samples can mislead
- Overfitting models that don’t work in real life
- Wrong assumptions can lead to wrong conclusions
Tip: Use your brain along with your tools—critical thinking matters!
What’s the Future of Quantitative Data Analysis?
The future is exciting and fast-moving. Here’s what’s changing:
- AI & Machine Learning are automating analysis
- Cloud Platforms allow collaboration from anywhere
- Real-time analytics helps businesses make instant decisions
- Data for All: Tools are becoming easier for non-tech users
As more data is generated daily, the demand for skilled data analysts is growing.
Conclusion: Start Your Data Journey Today
Quantitative data analysis is more than just crunching numbers. It’s about discovering insights that help you grow, improve, and make smart decisions.
Whether you’re a student, a working professional, or someone exploring new careers, learning data analysis is a future-proof skill.
Ready to Get Started?
If you’re serious about building a career in data analytics, Console Flare offers hands-on training led by industry experts. You’ll work on real projects, get placement support, and learn the exact tools used in the field.
Take your first step into the world of data—the future is in your hands.
For more such content and regular updates, follow us on Facebook, Instagram, LinkedIn