For a long time, data lived comfortably inside rows and columns. Tables worked fine when information was simple and mostly independent. But that world has changed.
Today, data is deeply connected.
Users follow other users. Products relate to other products. Devices communicate with multiple devices. A single transaction can touch many systems at once. When data starts behaving like a web of connections instead of neat rows, traditional tables begin to struggle.
This is where graph databases and network analytics come into play—and Python sits right in the middle, helping us make sense of it all.
Why Data Is No Longer Just Tables?
Think about social media for a moment.
You don’t just have users. You have:
- Users following other users
- Posts liked by many people
- Messages sent between devices
- Recommendations based on shared interests
Trying to represent all this using tables quickly becomes messy. You end up with endless joins, slow queries, and logic that’s hard to maintain.
Graphs solve this problem by focusing on relationships first, not rows.
Instead of thinking in tables, you think in:
- Nodes → things (users, products, devices)
- Edges → connections (follows, buys, sends, connects)
This shift makes complex systems much easier to understand and query.
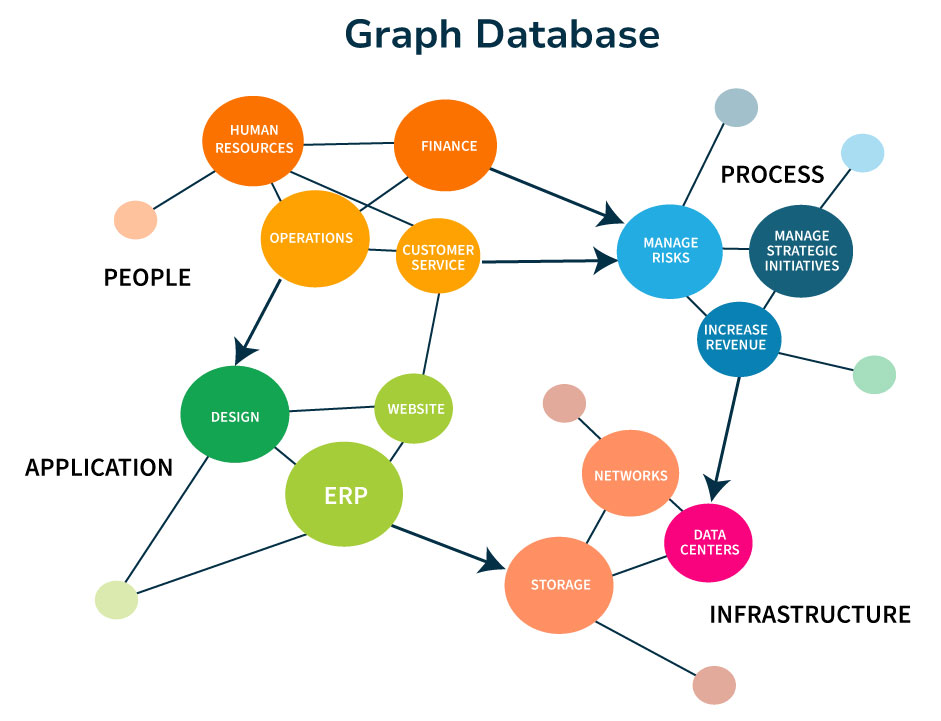
What Is a Graph Database (In Simple Terms)?
A graph database is designed to store and query connected data efficiently.
Unlike traditional databases that focus on tables, graph databases are built to answer questions like:
- Who is connected to whom?
- How many steps connect user A to user B?
- What is the fastest or shortest path between two points?
Popular graph databases include:
- Neo4j
- JanusGraph
These databases are optimized for relationship-heavy queries and can traverse connections much faster than traditional databases when the data is highly connected.
Think of a graph database as:
A fast, efficient storage system for connected data.
Understanding Graphs Without the Theory Headache
You don’t need deep math to understand graphs.
At a basic level:
- Nodes are entities (people, products, locations)
- Edges are relationships (follows, purchased, routes)
Some relationships have direction:
- A follows B (not always the other way around)
Some relationships have weight:
- Distance between two cities
- Cost of a transaction
- Time taken to travel
That’s it. Everything else builds on these simple ideas.
Graph Databases vs Network Analytics (Important Difference)
This part is often confusing for beginners, so let’s keep it simple.
Graph Databases
- Store connected data
- Answer relationship-based queries quickly
- Handle large and growing networks
- Focus on retrieving data
Network Analytics
- Analyze how the network behaves
- Measure importance, influence, or connectivity
- Find communities, clusters, or unusual patterns
- Focus on understanding data
In real-world systems:
- The graph database stores the data
- Python analyzes the data
They work best together, not as replacements for each other.
Why Python Fits So Well with Graph Data?
Python has become the go-to language for data work—and graph analytics is no exception.
Python is:
- Easy to read
- Easy to learn
- Flexible
- Rich in libraries
Most Python applications work like this:
- Connect to a graph database
- Run queries to fetch nodes and relationships
- Analyze the data in memory
- Produce insights, reports, or models
Python lets developers focus on logic and insights, while the database handles heavy traversal work.
Working with Graph Databases Using Python
Python usually acts as a client when working with graph databases.
For example, Neo4j uses a query language called Cypher, which feels very natural:
- You describe patterns
- The database finds matching paths
With Python, you can:
- Securely connect to the database
- Run parameterized queries
- Fetch nodes, edges, and paths
- Convert results into DataFrames or objects
This separation keeps systems clean:
- Database → storage and traversal
- Python → analysis and application logic
What Is Network Analytics?
Once data is loaded into Python, network analytics helps you understand how the network behaves.
Instead of asking:
“Who is connected to whom?”
You start asking:
- Who is the most influential?
- Who connects different groups?
- How fast does information travel?
- Where are the weak points?
This analysis is usually done in memory using Python libraries.
Common Network Metrics (Explained Simply)
You don’t need to memorize formulas. Just understand what they mean.
- Degree centrality
Who has the most connections?
- Betweenness centrality
Who acts as a bridge between groups?
- Closeness centrality
Who can reach everyone else fastest?
- Clustering coefficient
How tightly connected is a group?
These metrics answer real business questions like:
- Who are the influencers?
- Where are the bottlenecks?
- How resilient is the system?
Finding Communities in Graphs
One of the most powerful uses of network analytics is community detection.
Communities are groups of nodes that are more connected to each other than to the rest of the network.
This is widely used in:
- Social networks
- Marketing segmentation
- Recommendation systems
- Biology and healthcare
Python libraries allow analysts to see patterns that are not obvious when looking at raw data.
Real-World Applications of Graph Analytics
Graph databases and Python analytics are already used across industries:
- Recommendation systems: Suggest products or content based on user behavior
- Fraud detection: Identify suspicious transaction patterns
- Supply chain analysis: Detect weak links and dependencies
- Search engines: Rank pages and connections
- Cybersecurity: Spot unusual communication behavior
The real value comes not just from storing relationships, but from analyzing them at scale.
Final Thoughts
Graphs don’t replace traditional databases—but they complement them.
Whenever data becomes highly connected, graph-based approaches offer clarity that rows and columns cannot.
Python makes this approach practical. Its simplicity, flexibility, and ecosystem allow developers and analysts to experiment, learn, and build solutions without unnecessary complexity.
As systems become more connected and data continues to grow, understanding graph databases and network analytics will no longer be optional—it will be a valuable skill for the future.
Follow us on Facebook, Instagram, and LinkedIn for more useful advice, real-world examples, and career counseling.