


Date Handling in Pandas in Easy Steps
Date handling is part of most data projects. You sort timelines, filter periods, and calculate gaps. Pandas gives you direct tools for this. This guide walks you through each step in a simple way so you understand what the code does and why it matters.

Start Your Date Handling With Clean Data
You load your CSV file and check the structure.
import pandas as pd
df = pd.read_csv('expense.csv')

print(df)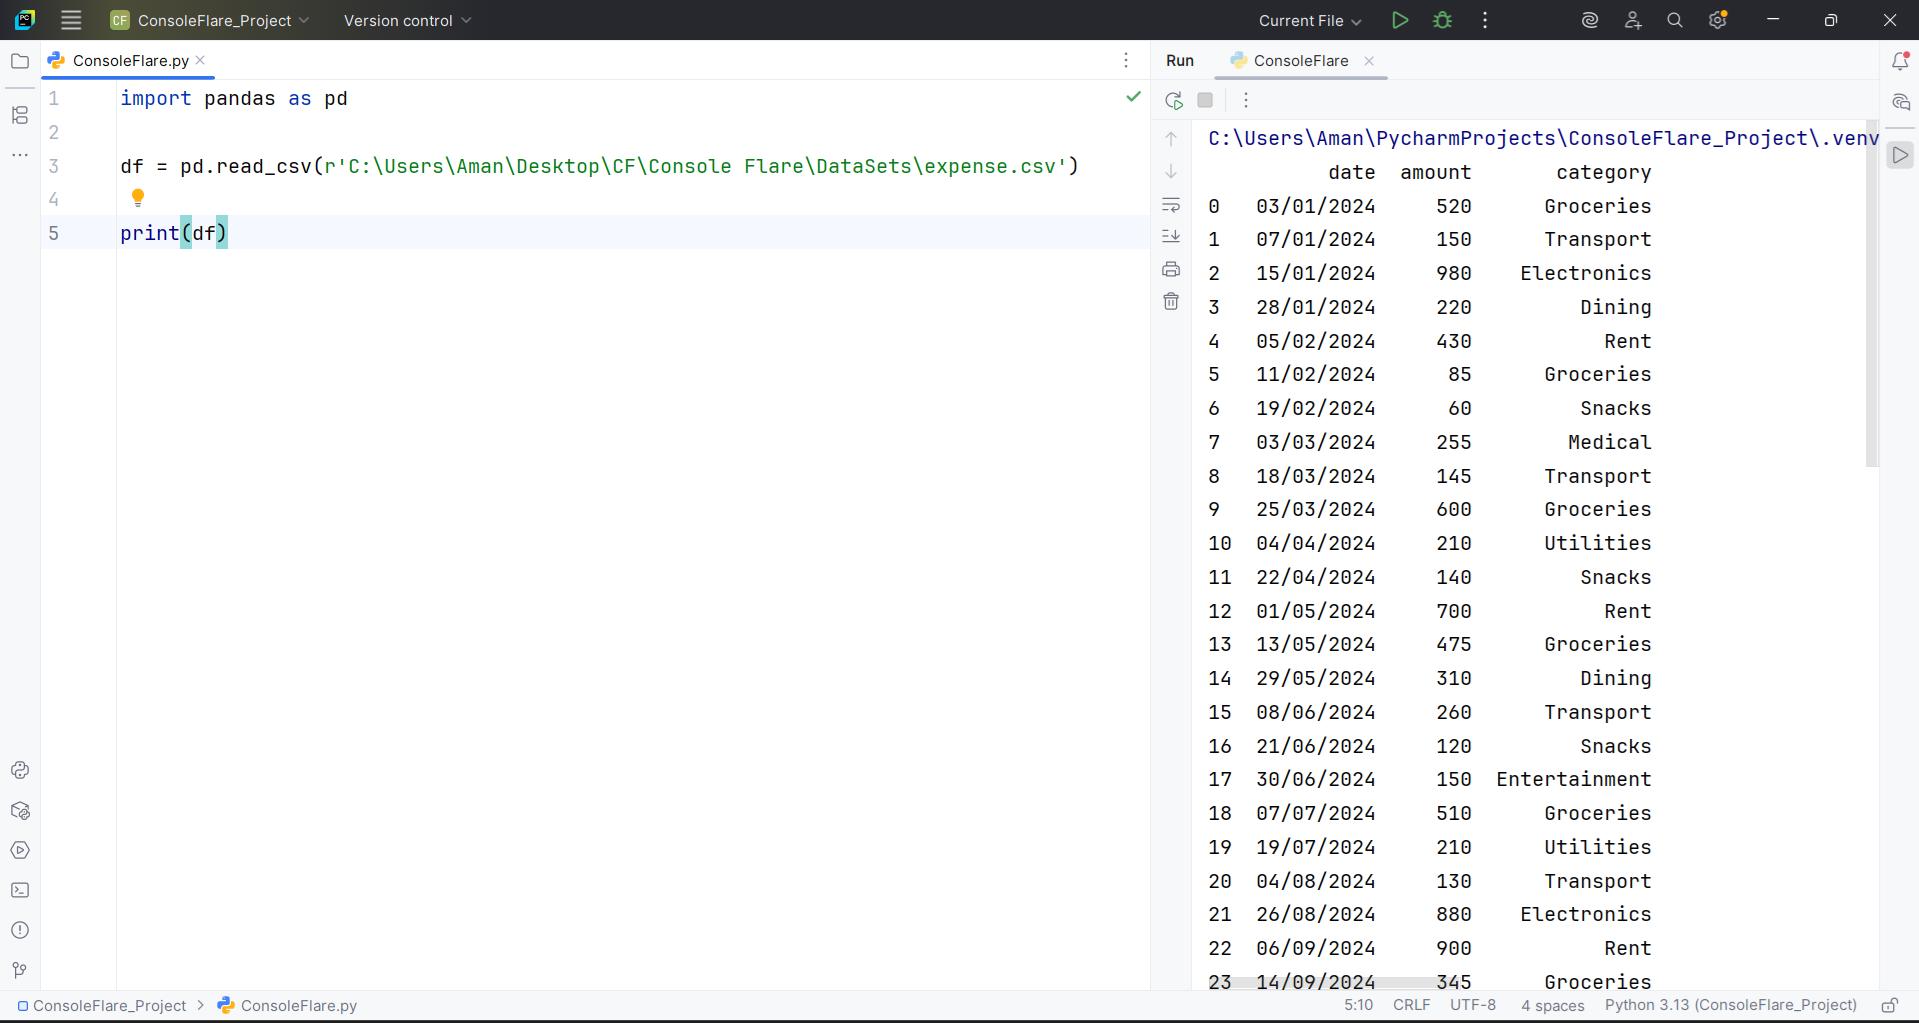

df.info()df.info() shows column names, data types, and total rows.
If your date column appears asobject, it is still text. You must convert it before using it.
Convert Text Dates for Accurate Date Handling
Clean date handling starts with conversion.
df['date'] = pd.to_datetime(df['date'], format='%d/%m/%Y')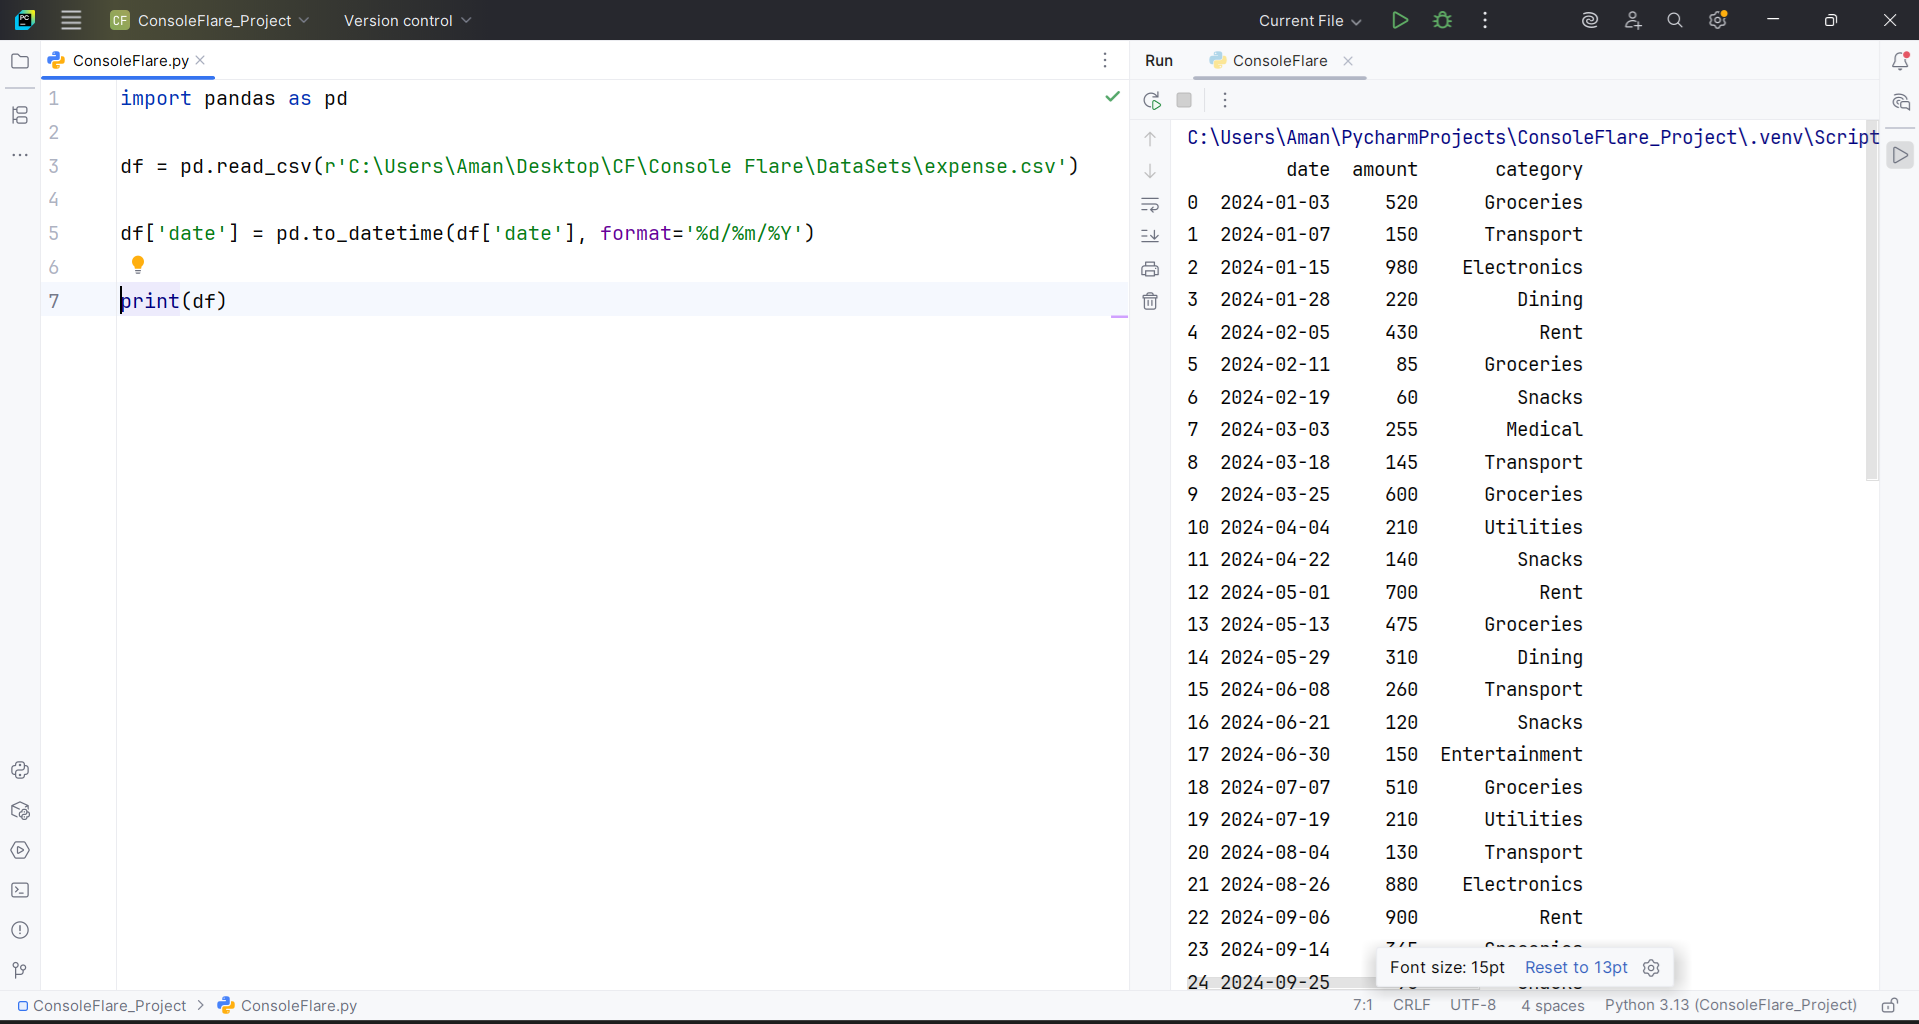

Pandas matches each string with the pattern, then turns the column into a real datetime.
Values that do not follow the format cause an error, which keeps your data consistent.
Check Sample Rows
df.head()
This helps you confirm the conversion. Pandas displays dates in year, month, day format.
Find the Date Range
df['date'].min()
df['date'].max()
You get the oldest and newest date.
This tells you the coverage of your dataset.
Apply Date Handling Filters in Pandas
Pick a single date.
df.loc[df['date'] == '2024-01-28']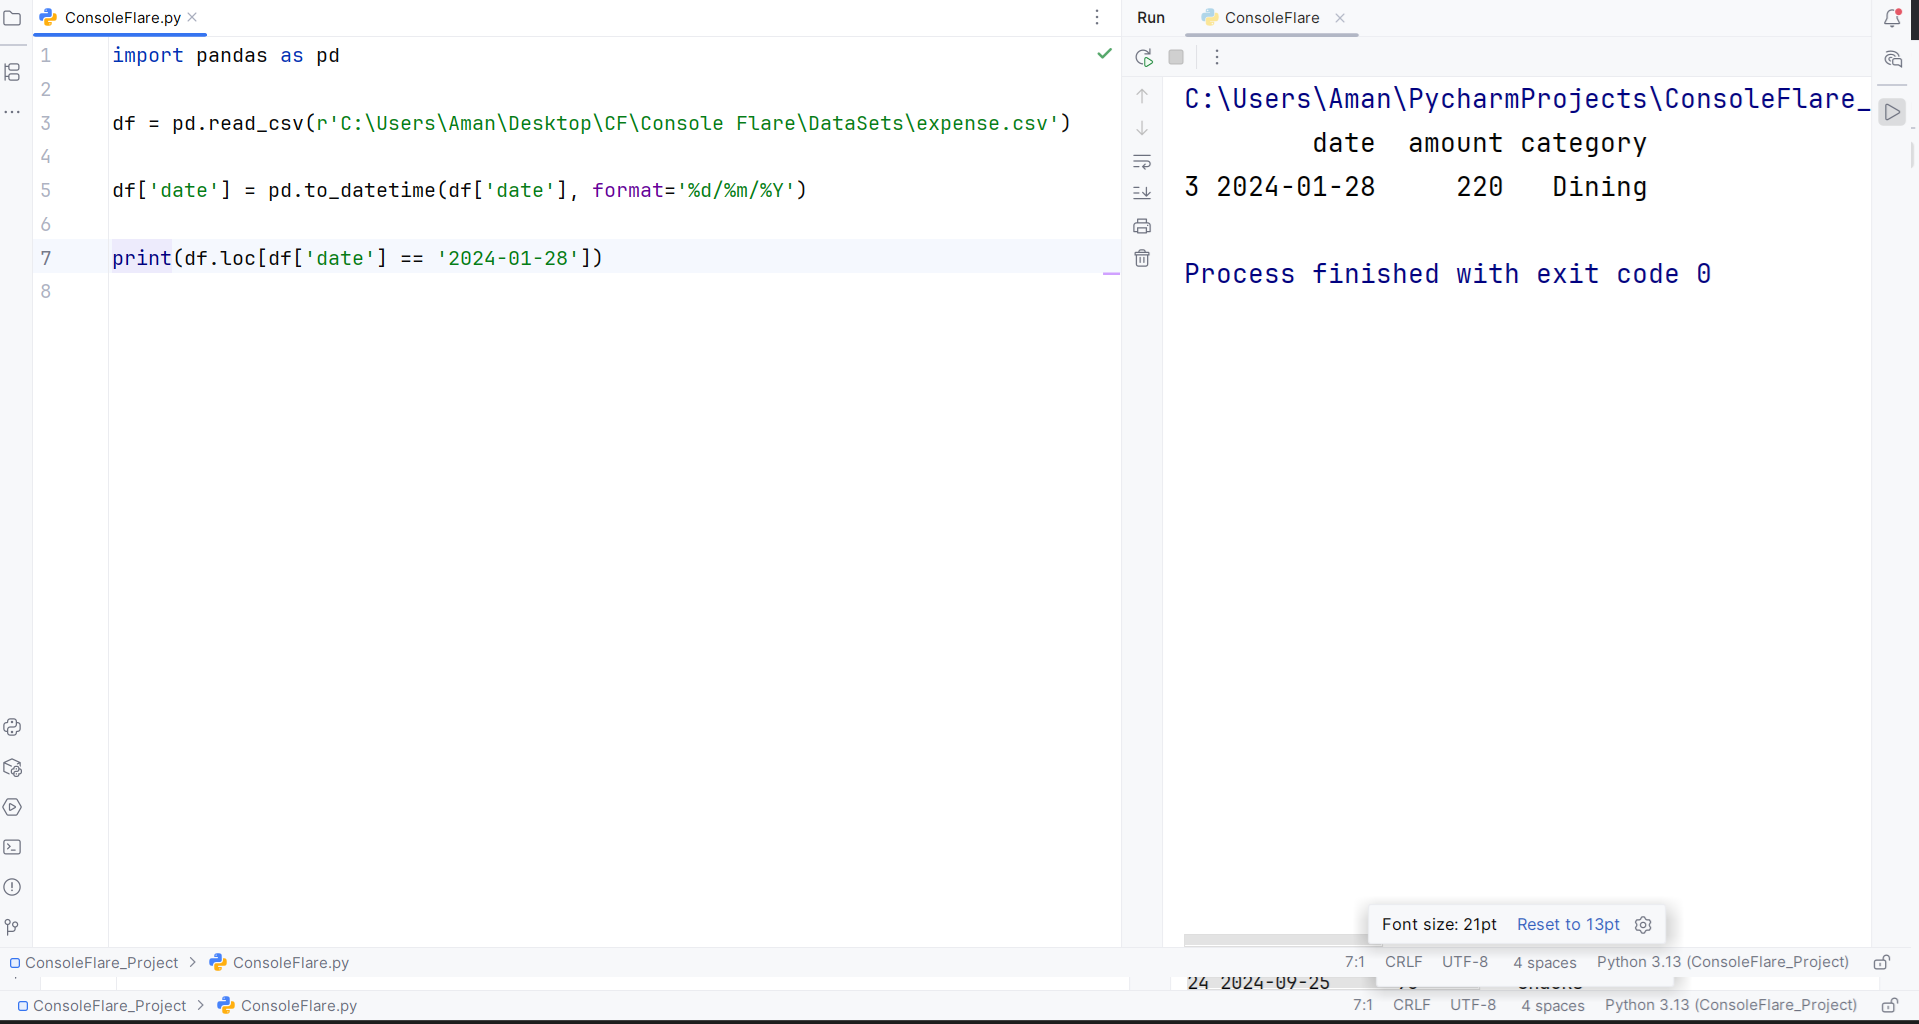
Pick all dates after a point.
df.loc[df['date'] > '2024-01-28']Pick a range.
df.loc[df['date'].between('2024-01-28','2024-02-28')]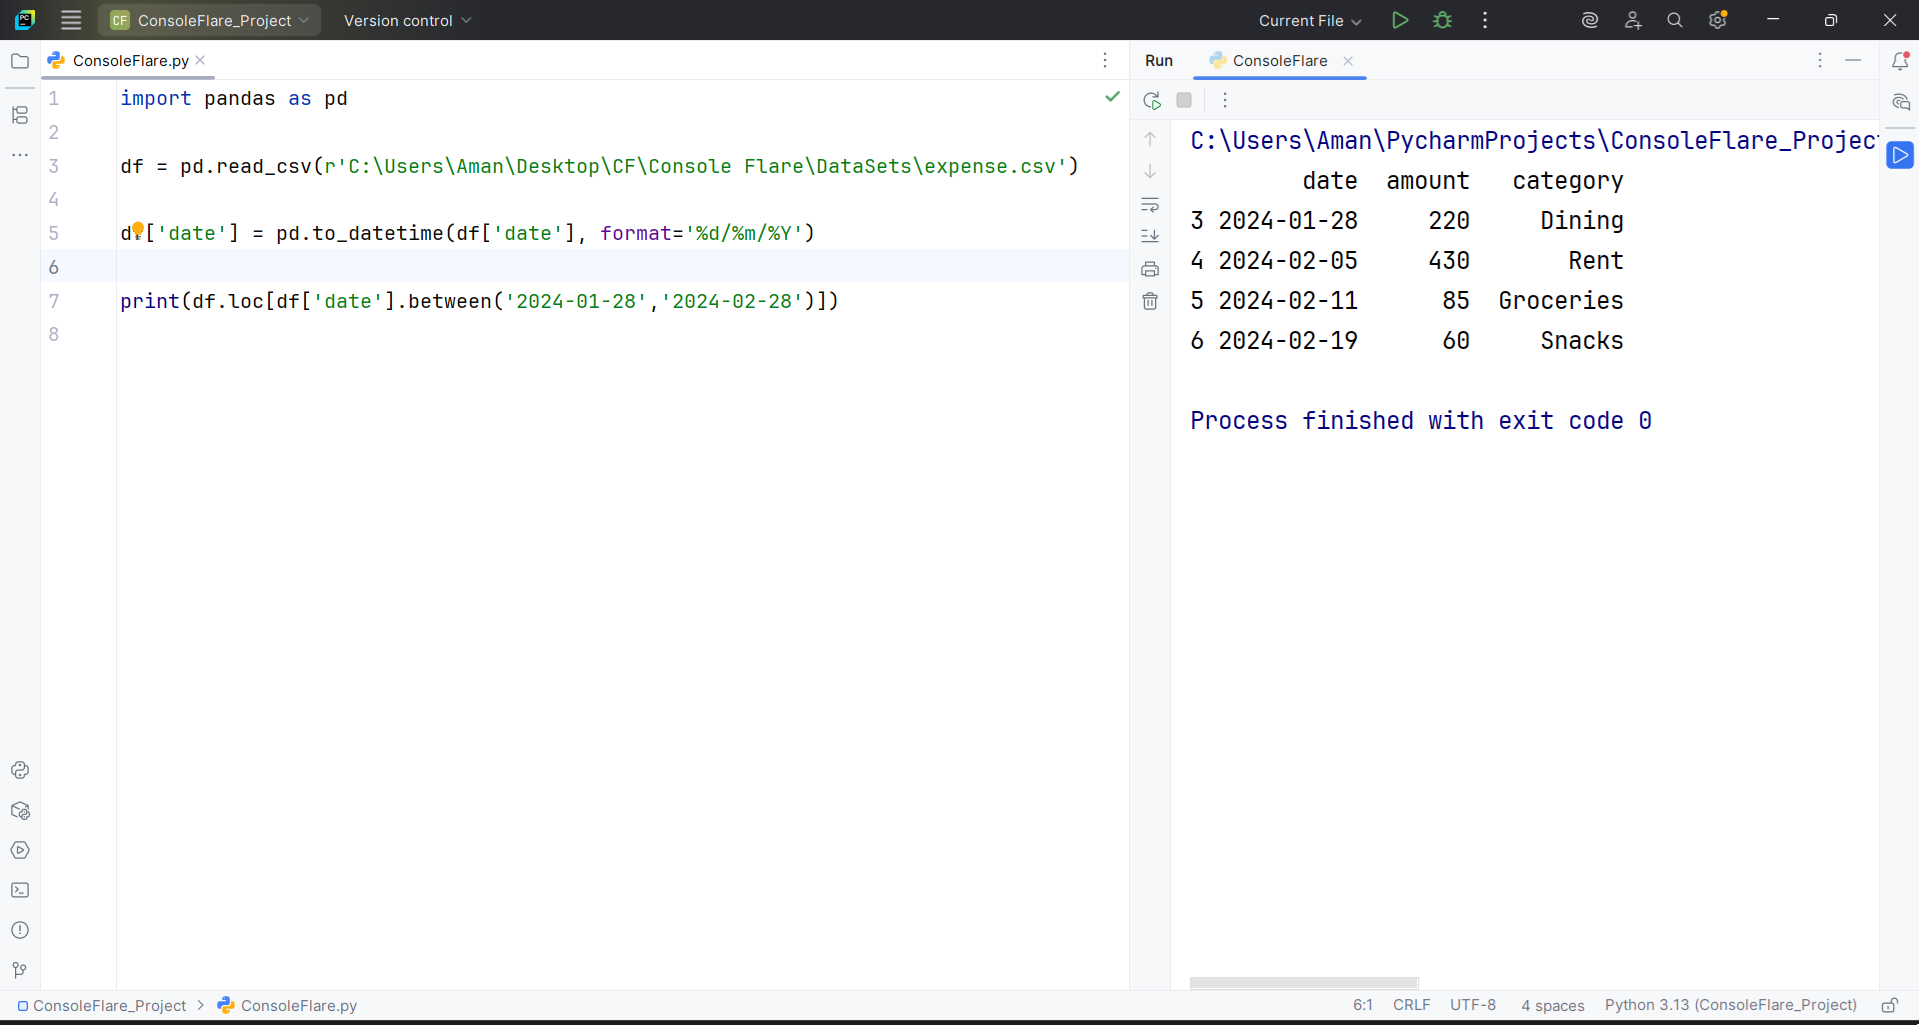

These filters help you build quick subsets for analysis.
Sort Dates for Better Date Handling
sorted_df = df.sort_values('date')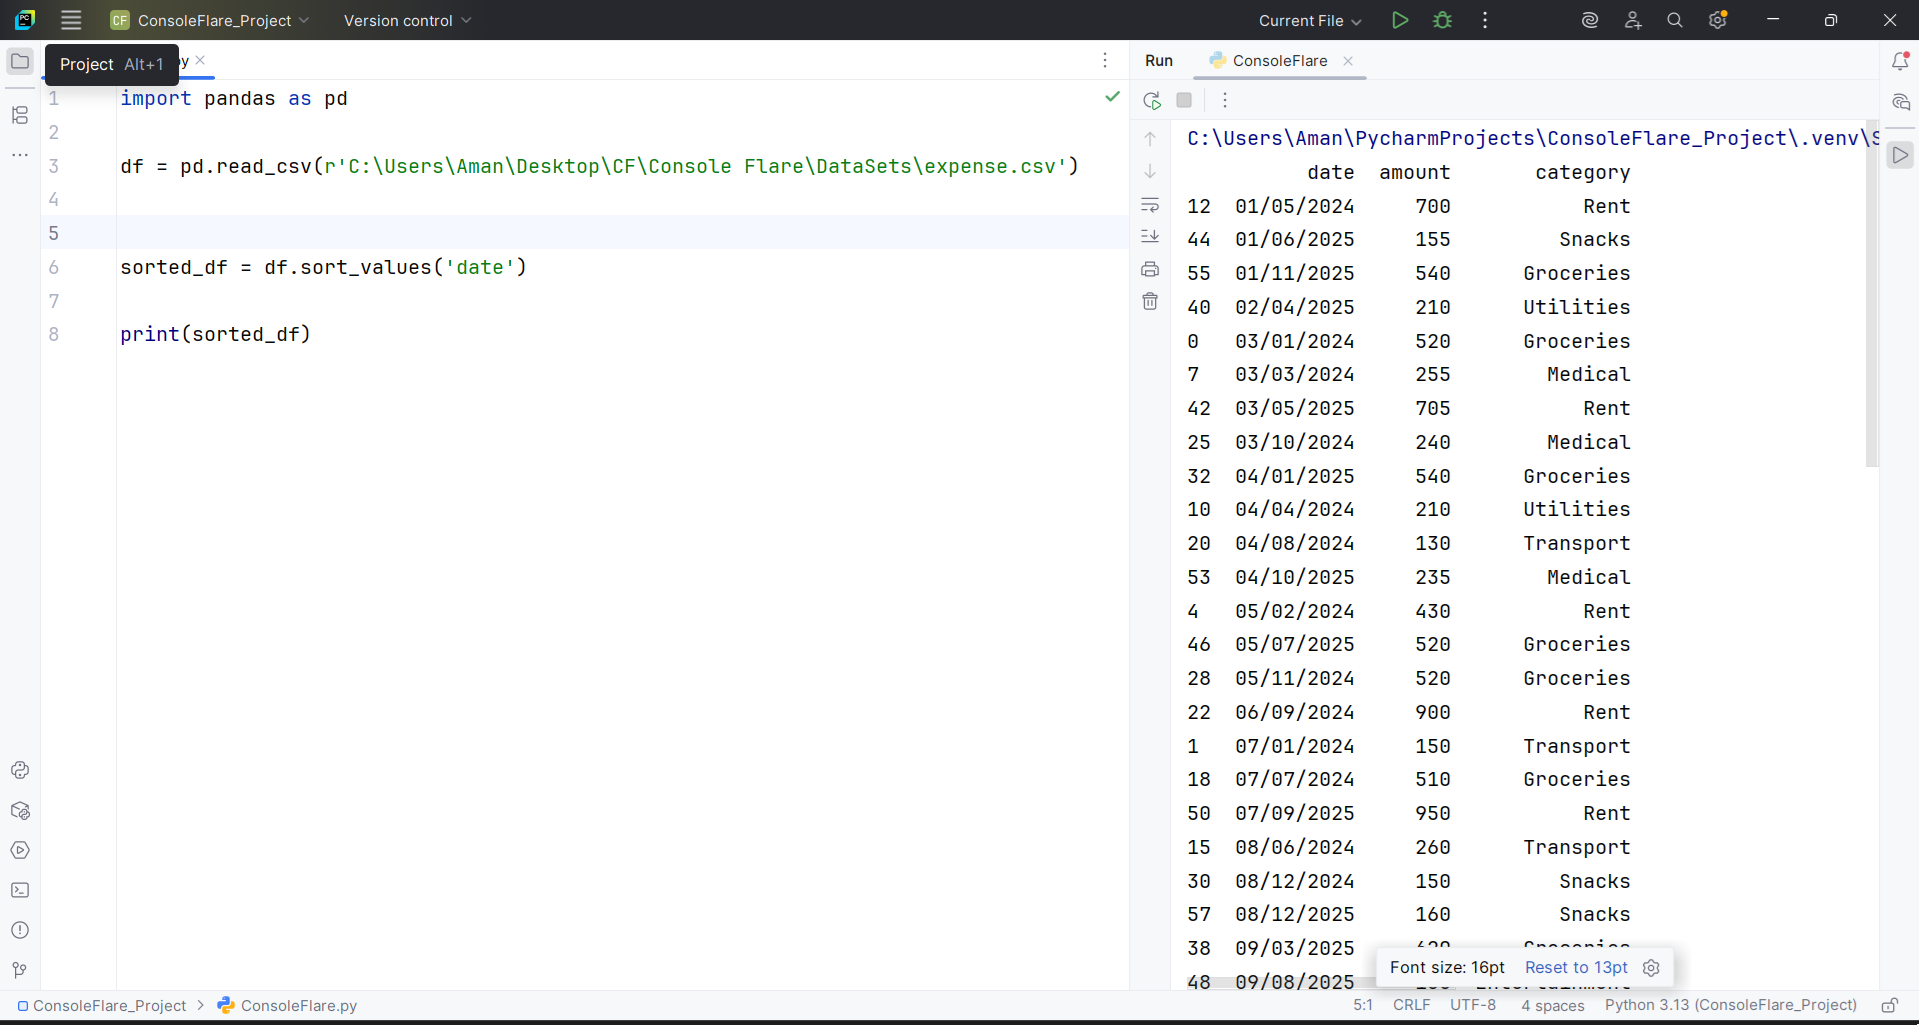
This sorts the timeline from oldest to newest. Sorting is key for smooth date handling.
Break Dates Into Parts for Better Handling
df['day'] = df['date'].dt.day
df['dn'] = df['date'].dt.day_name()
df['month'] = df['date'].dt.month
df['mn'] = df['date'].dt.month_name()
df['year'] = df['date'].dt.year
df['q'] = df['date'].dt.quarter
You extract day, weekday name, month number, month name, year, and quarter.
These fields help you build clean summaries and dashboards.
Date and Time Handling in Pandas
Some files are stored in one field. Convert them properly.
df = pd.read_csv('expense_datetime.csv')
df['date'] = pd.to_datetime(df['date'], format='%Y/%m/%d %H:%M:%S')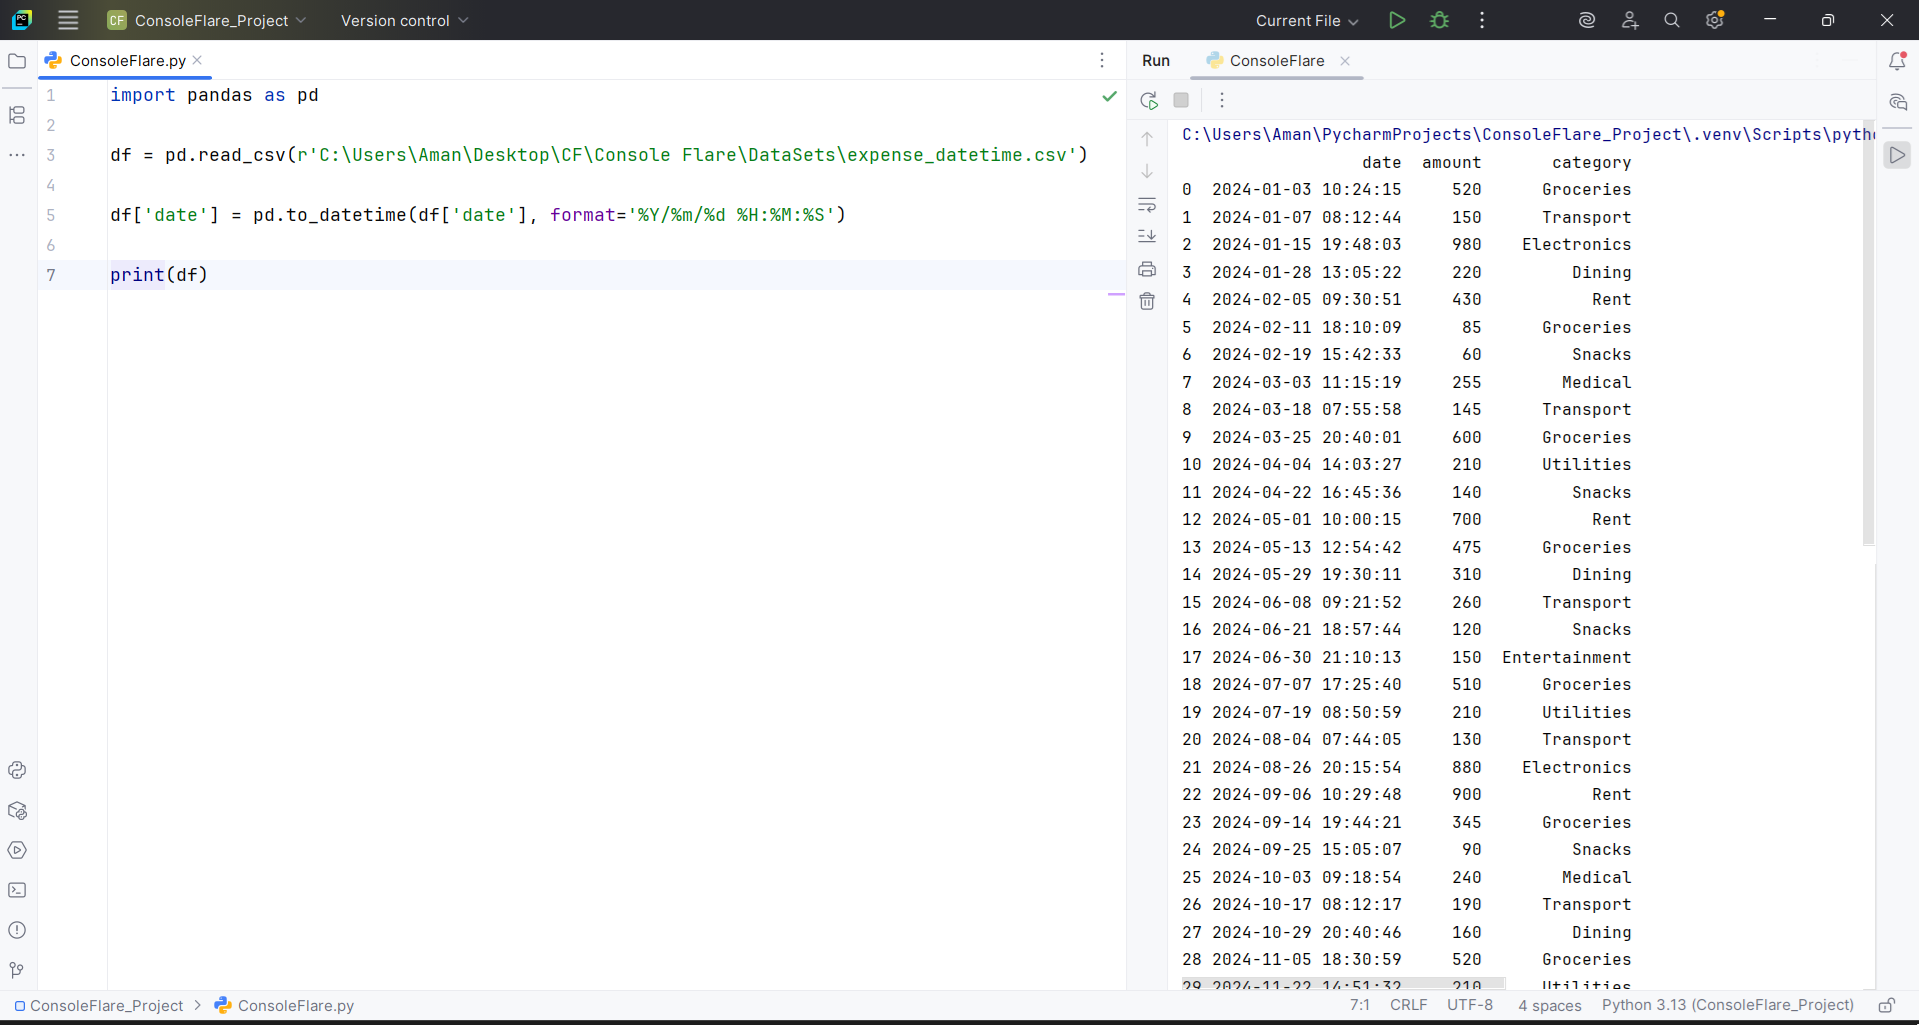
You now have full timestamps.
This improves filtering and gap calculations.
Extract Only Date or Time
df['onlydate'] = df['date'].dt.date
df['time'] = df['date'].dt.time
df['hour'] = df['date'].dt.hour
df['minute'] = df['date'].dt.minute
df['second'] = df['date'].dt.second
These fields help you track hourly activity or specific time patterns.
Format a Date for Display
df['display_date'] = df['date'].dt.strftime('%d/%m/%Y %H:%M:%S')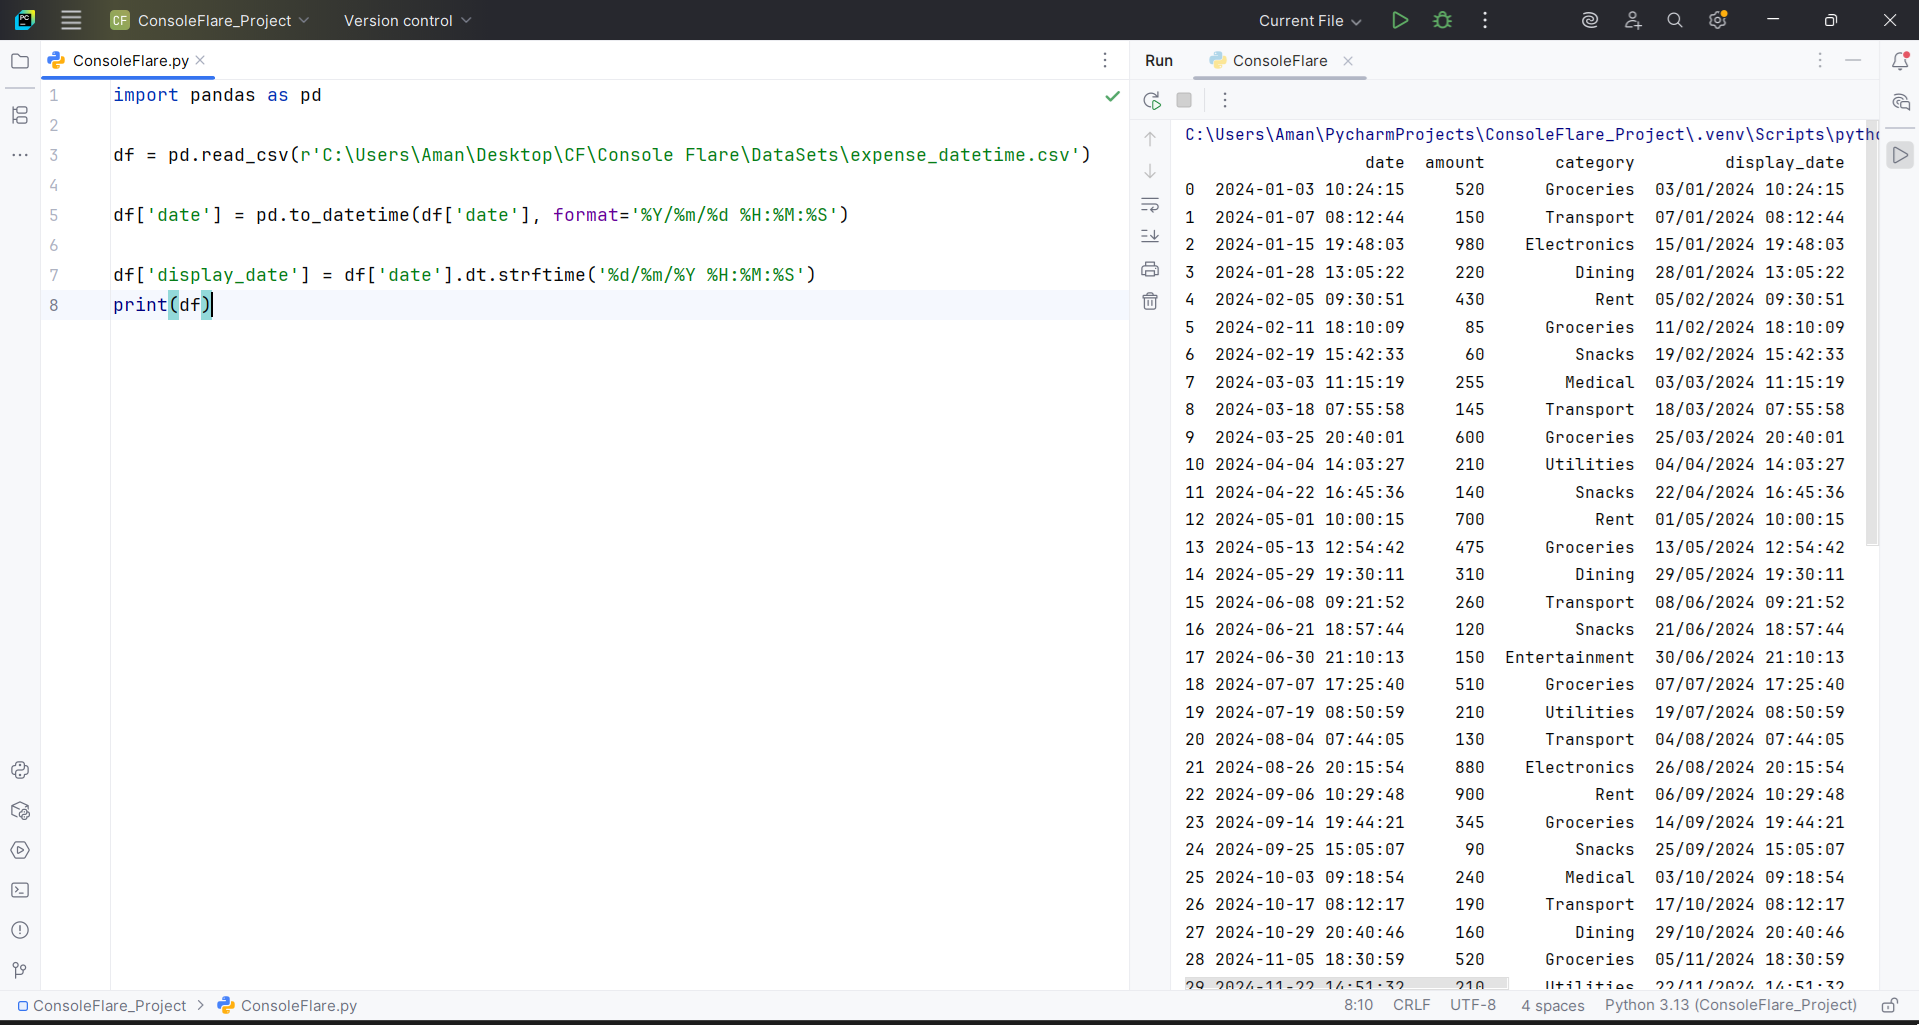
This produces a clean string for reports.
The original datetime stays unchanged.
Calculate Days Between Two Dates
df['order_date'] = pd.to_datetime(df['order_date'], format='%d/%m/%Y')
df['delivery_date'] = pd.to_datetime(df['delivery_date'], format='%d/%m/%Y')
df['diff'] = df['delivery_date'] - df['order_date']
df['diff'] = df['diff'].dt.days
You get the number of days between both events.
Useful for delivery time, project time, or process duration.
Calculate Time Difference in Minutes
df['promised'] = pd.to_datetime(df['promised'], format='%Y-%m-%d %H:%M:%S')
df['actual'] = pd.to_datetime(df['actual'], format='%Y-%m-%d %H:%M:%S')
df['gap'] = df['promised'] - df['actual']
df['gap'] = df['gap'].dt.total_seconds() / 60
You get the gap in minutes.
Positive and negative values show early or late outcomes.
Convert UNIX Timestamp
df['order_time'] = pd.to_datetime(df['order_time'], unit='s')This turns raw timestamp numbers into readable dates.
Yearly Summary
df['year'] = df['date'].dt.year
mdf = df.groupby('year').agg(
    total_expense=('amount','sum'),
    avg_expense=('amount','mean'),
    median_expense=('amount','median'),
    max_expense=('amount','max'),
    min_expense=('amount','min')
)
You get a clean yearly report with totals and averages.
Weekday Summary
df['day_name'] = df['date'].dt.day_name()

mdf = df.groupby('day_name').agg(
    total_expense=('amount','sum'),
    avg_expense=('amount','mean')
).sort_values('total_expense')
You see which weekday has the most or least activity.
Final Notes
Convert your dates first.
Use the correct format.
Use dt functions for extraction.
Use groupby for summaries.
These steps help you handle dates with confidence.
Internal link:
Value_counts and Groupby in Pandas Explained in Easy Steps
Aggregate Functions in Pandas: Beginner’s Guide with Examples
Filtering in Pandas: Learn loc, iloc, isin(), and between()
Load Data in Pandas – A Complete Beginner’s Guide to Data Import
Pandas official documentation:
https://pandas.pydata.org/docs/ag
Conclusion
Date handling is a core skill for every data professional, and the Pandas tools you learned here form the base for real project work. At ConsoleFlare, learners practice these skills daily through guided exercises, real datasets, and hands-on mentoring. You not only learn how to parse dates, filter timelines, and build summaries, but you also learn why these steps matter in real analysis.
The training focuses on clarity and confidence. Every learner gets support to understand Python, Pandas, SQL, and the workflow needed in data roles. These foundations prepare you for interviews and real on-the-job tasks where clean date handling and accurate timelines are critical.
If you want a future-proof career in data, strong mentorship is the difference. ConsoleFlare helps you build these skills step by step so you move into the industry with practical knowledge and confidence.
For more content and updates, follow us on Facebook, Instagram, and LinkedIn.