


The world is all about numbers today. Financial figures are what keep businesses and banks running, stock markets active, and even a small shop gets by on financial figures. The raw numbers, though, are tough to put into perspective. A congested Excel will have you staring for hours on rows with hundreds, if not thousands, of records — not the easiest to figure out into sheets. That’s where data visualization comes in. Data visualization is the technique of physically converting numbers to charts, graphs, and dashboards in order to facilitate quick and efficient understanding of financial information.
When we speak of data visualization here, it can help you with making better and quicker financial decisions, whether you are a company CEO having to decide where to invest next, a financial analyst preparing a report, or even a small business owner checking sales every month.
What is Data Visualization in Finance?
It is the visual representation of financial data using tools such as graphs, pie charts, heat maps, dashboards, etc. Rather than reading the raw numbers of profit and loss, decision-makers can visually see patterns and trends.
For example:
- It makes it easier to find peak seasons if you have a bar chart, as in the case of sales growth across months.
- Investors have to decide to buy or sell stock when the stock price line graph is moving.
- Managers can assess whether the company is on track by looking at a dashboard with key metrics such as revenue, expenses, and cash flow.
To sum it up, visualization does the job of breaking down complex financial data into simple, fast, and actionable information.
Why is Data Visualization Important in Financial Decision-Making?
Financial decisions are risky. An error of a second can be ruinous for him. Data visualization creates clarity and lessens uncertainty for organizations. Now, let’s check out the top reasons that make visualization necessary.
5 Reasons why data visualization is necessary in financial decision-making
1. Simplifies Complex Data
For most laymen, financial data may sound like it is in some long spreadsheet table with numbers all over the place. What this means for visualization is that this complexity is distilled to meaningful, simple visuals such as graphs or charts. This allows anyone without any financial background to easily grasp the main idea and take action.
2. Identifies Trends and Patterns
A line chart or a bar graph can easily point to an upward or downward move, whereas numbers themselves may not show a lot. These trends help the business sector anticipate risks, identify opportunities, and formulate strategies that adapt to the dynamic nature of the market.
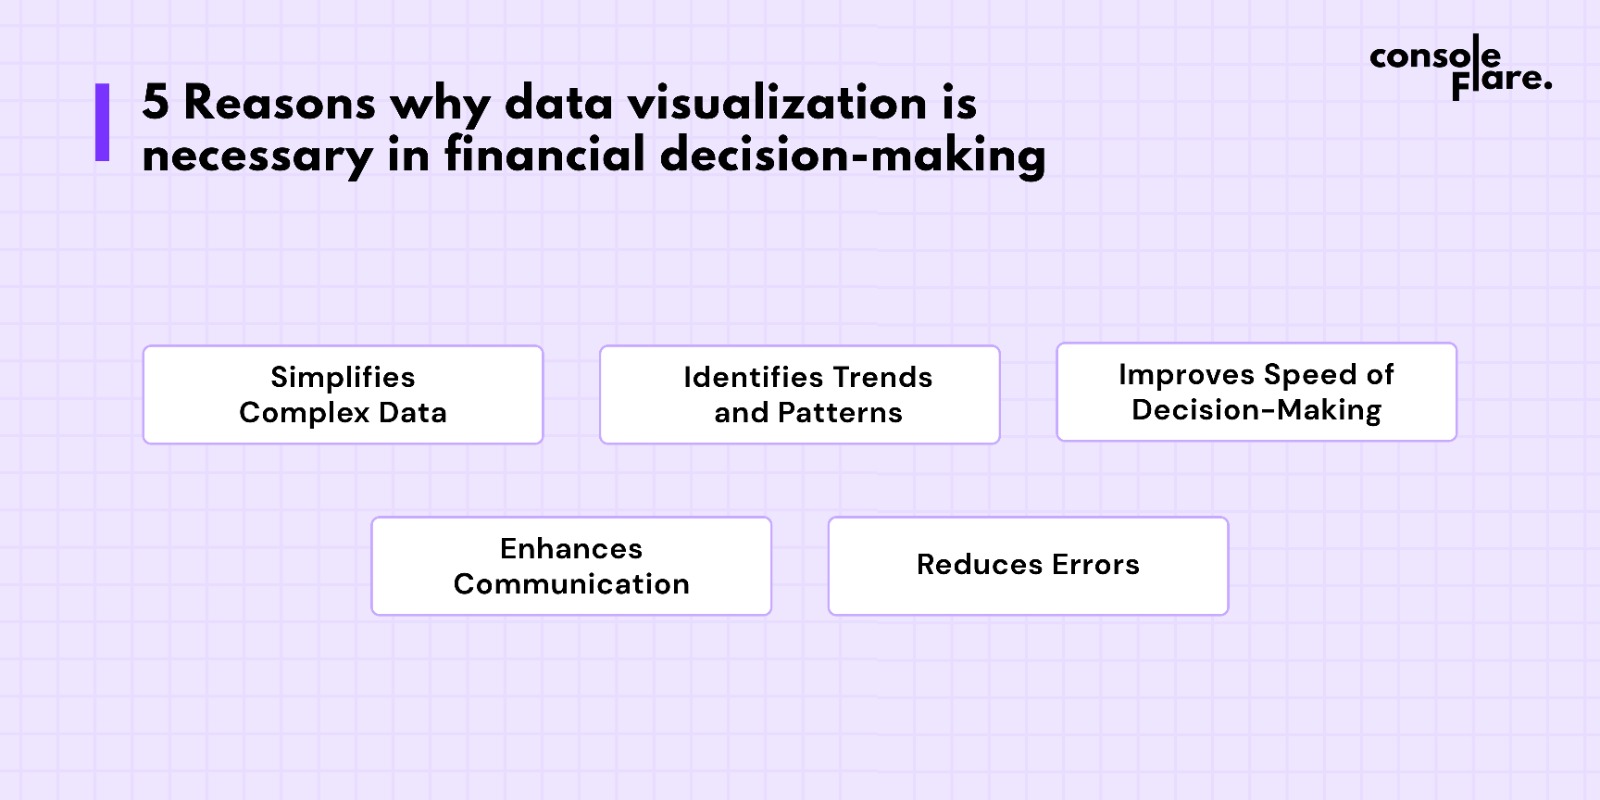

3. Improves Speed of Decision-Making
Time is financial money. A dashboard designed visually and with real-time updates in a few seconds, which otherwise required hours of analysis. When a huge decision has to be made, the decision-makers can easily look at the comparison between the average revenue, average costs, and average profits and thus react much faster to dynamic situations (for example, a shift in the stock market) or even during budgeting.
4. Enhances Communication
Not everyone understands financial language. This is where visualization comes into play, as it transforms raw data into understandable visuals. Moreover, when managers start sharing charts instead of tables — communication improves, board meetings become simpler, and the individuals get full insight into the financials, whether technical or non-technical — without friction or delay.
5. Reduces Errors
Raw numbers often hide errors well, but they pop out beautifully in a visual. All it takes is one graph to show you a sudden sales downturn, a revenue spike, or an expense mismatch. This minimizes expensive errors and gives businesses the ability to fix issues before they escalate.
Real-Life Examples of Data Visualization in Finance
So again, bringing it down to real life, here are some practical scenarios in which the helping hand of data visualization can be:
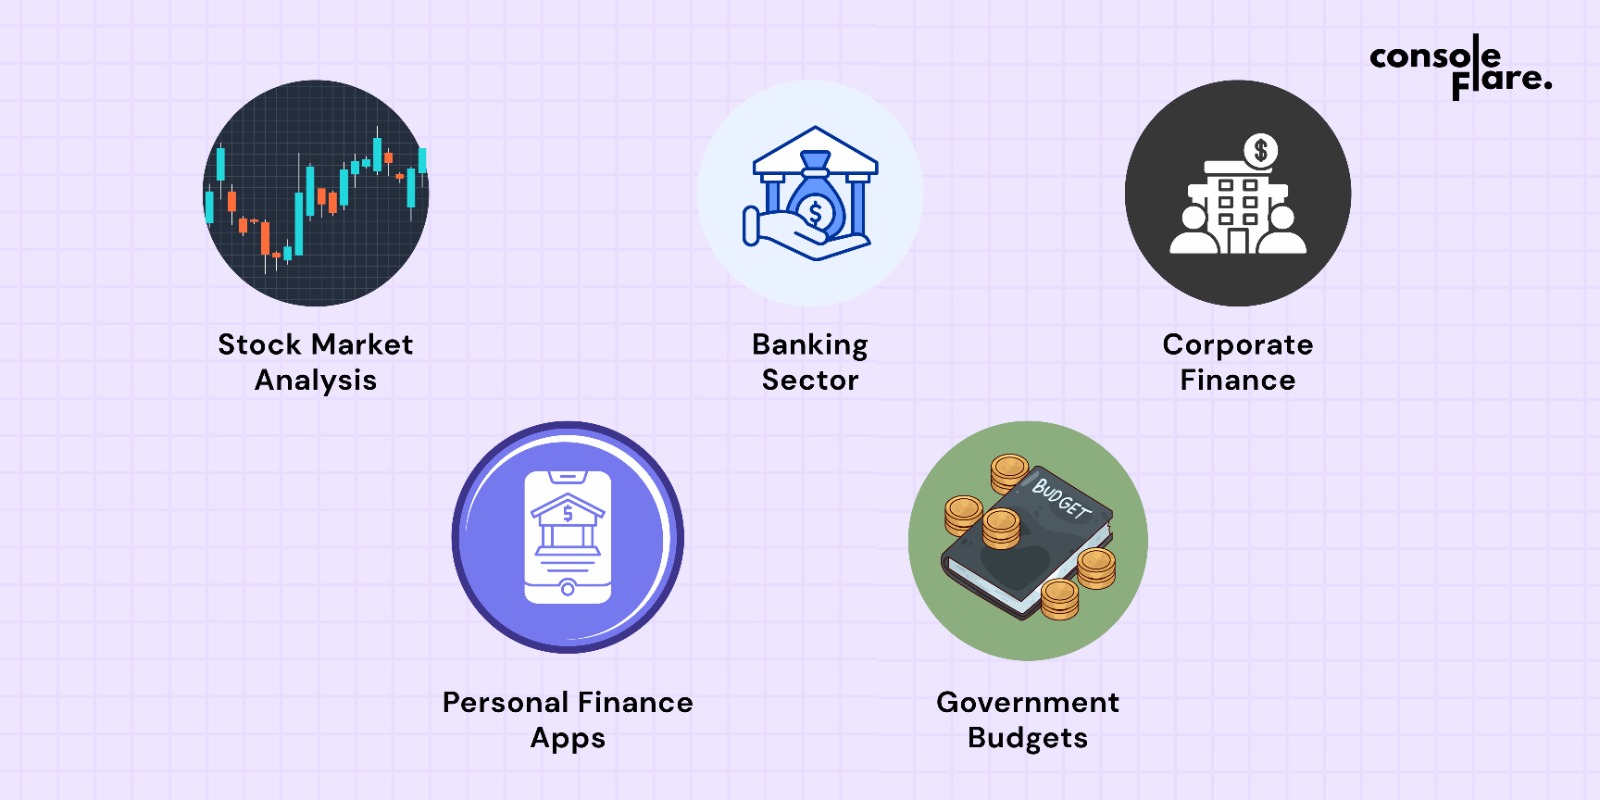

Stock Market Analysis: Candlestick Charts and Line Graphs t Study the Market Trend before Trading on the Stock Market.
Banking Sector: Dashboards in banking are used to monitor the performance of loans, customer payments, and fraud detection.
Corporate Finance: Financial dashboards are created by companies for revenue, costs, and profits to plan budgets and investments.
Personal Finance Apps: Several apps, such as Paytm or Google Pay, help track every monthly expense to monitor the spending habits of the user.
Government Budgets: Government departments submit yearly budgets containing infographics and charts so that ordinary individuals can easily comprehend how much money is being spent on each sector.
Tools Used for Data Visualization in Finance
There are so many tools that can help you to present your financial visualizations. The options range from simple and free to complex, advanced, and used by large companies.
- Excel and Google Sheets: Usually used for bar charts, pie charts, or pivot tables
- Power BI and Tableau: Widely used tools for building interactive dashboards and high-level visualizations.
- Python and R: These tools are used by data analysts to perform customized financial analysis and visualizations.
- Business Intelligence Platforms: These are bigger platforms leveraged by banks and corporates for production-scale financial statements.
How Data Visualization Helps in Different Areas of Finance?
Investment Decisions
Stock charts, heat maps, and portfolio dashboards – investors are dependent on visuals to analyze performance. These tools unlock profitable sectors, the volatility of the market, and risk levels. Clear financial visuals steer investors towards safe, high-yielding, and timely investment decisions in the fastest way possible.
Risk Management
In Finance, come what may, a risk can surface in any segment of the segment- from Fraud to a deep crash, a very genuine risk! With visualization tools, out-of-the-ordinary patterns, anomalies, and suspicious behavioral patterns are revealed on the spot. With the help of a risk dashboard where risks are clearly shown, managers are able to detect threats well in advance to safeguard the organization from severe financial losses and disturbance in operations.
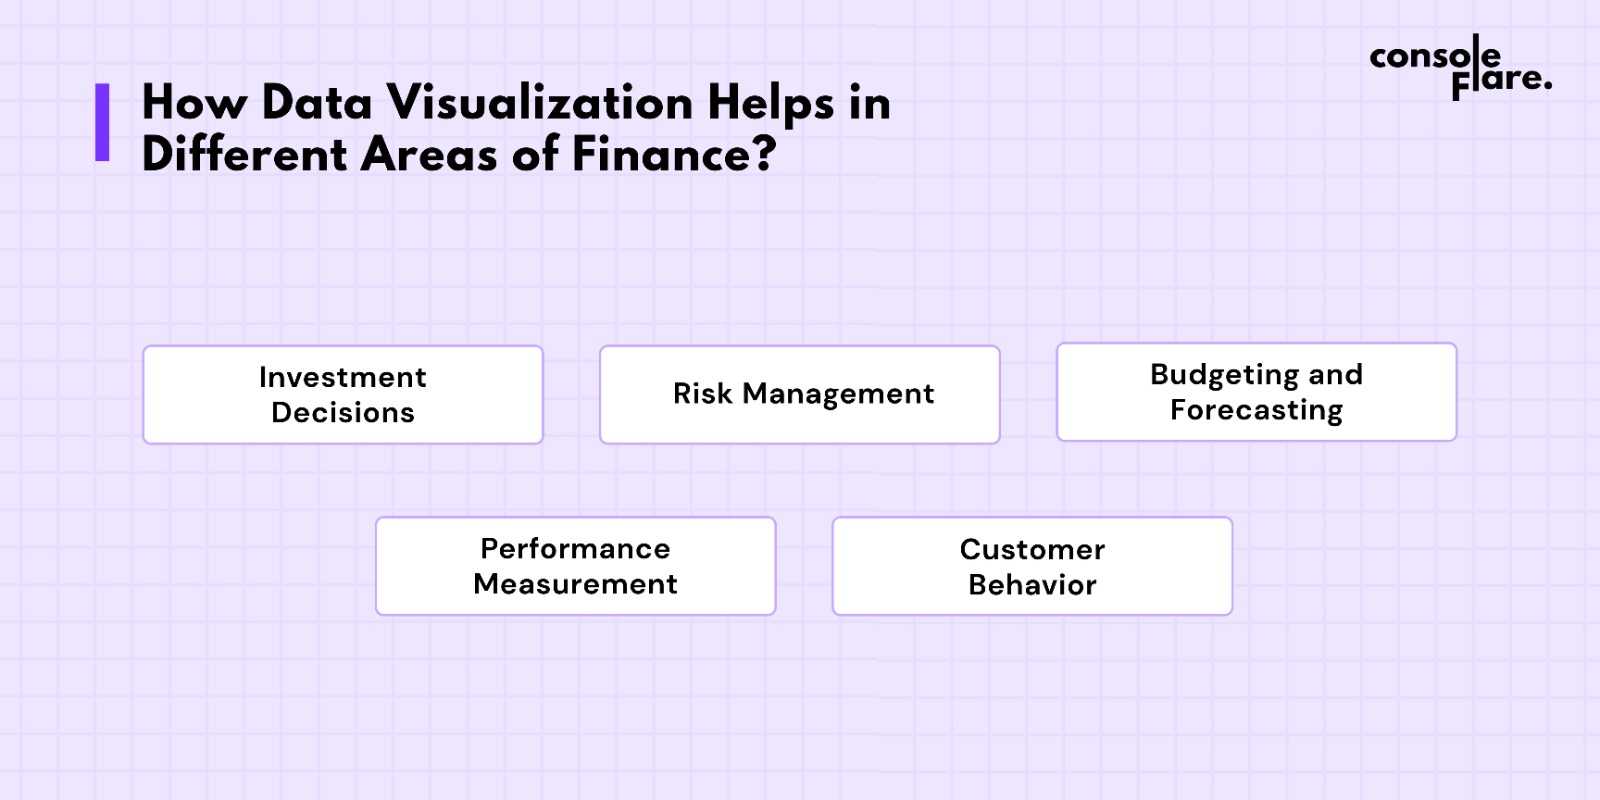
Budgeting and Forecasting: Budgets are simplified into charts and forecasting graphs, providing an overview of revenues, expenses, and profits. Using historical data, managers imagine what may happen in the future. It assists in the allocation of resources, planning for scaling, and reducing the likelihood of spending too much, which could otherwise endanger long-term viability.
Performance Measurement: ROI, profit margins, cash flow, etc., are KPIs that organizations track visually. Dashboards provide real-time updates for these metrics to show status against goals. This enables managers to keep an eye on the performance, reward hitting the targets, and take corrective action speedily if targets are missed.
Customer Behavior: Banks and companies analyze customer spending via visualization. For instance, if visuals indicate a rise in online shopping payments, businesses can introduce offers for digital orders. Visualizing customer behavior is key to service design, success, satisfaction, and long-term profitability.
Future of Data Visualization in Finance
Visualization and technology will play a huge role in the future of financial decision-making. Financial dashboards will be smarter with Artificial Intelligence and Machine Learning. Not only are they going to demonstrate what has occurred, but also what may happen. A dashboard, for example, may use your historical data and market trends to forecast sales for the next few years.
Over the next few years, a larger number of businesses in India, irrespective of their size, will employ visualization while making daily financial decisions. We have moved on from spreadsheets to charts and dashboards — not just large chunks of data, but charts and dashboards — and everyone from startups to large enterprises will trust charts and dashboards.
Challenges in Using Data Visualization
Visualization is an interesting solution, but one that comes with a few drawbacks:
- Data Quality: If the data itself is wrong, it will mislead as well when used in the visualization.
- Over-Complication: Too many charts or flashy designs can be confusing rather than helpful.
- Skill Requirement: Some high-end tools need skill and training, which is not affordable for all companies.
But trained well and accustomed to the different situations, these hurdles can be tackled easily.
Conclusion
Financial decision-making resembles driving a car. If you had no dashboard, you would not know how fast you were going, how much gas you had, or even what direction you were headed. Similarly, if a business lacks data visualization, it cannot accurately track its financial direction. Visualization is not only about beautifying reports, it is about making better decisions, avoiding risks, and discovering opportunities.
As the financial awareness in India is enhancing day by day, data visualization can help anyone, ranging from a farmer to a CEO, make better financial decisions.
At ConsoleFlare, we are big on enabling people to acquire skills and be armed in the right way by building the capability to interpret data, visualize the insight, and make decisions that can surely make an impact because the ones who will always be a step ahead are the ones who will see the story behind the numbers.
For more such content and regular updates, follow us on Facebook, Instagram, LinkedIn