

10 Most Asked Pyspark Interview Questions and Answers for 2025
Mastering Big Data Analysis: Your Ultimate Guide to Pyspark Interview Questions and Answers In today’s rapidly evolving world, the sheer volume of data generated has led to an unprecedented demand for professionals who can harness this data to drive business insights. As a result, careers in big data analytics have become incredibly lucrative, with organizations…

10 Most Asked SQL Interview Questions With Detailed Answers
Unlocking Career Opportunities in Data Science with SQL Interview Questions In the dynamic landscape of careers, data science has emerged as a shining star. Its significance lies in its versatility, promising lucrative prospects for individuals from diverse backgrounds, be it tech-savvy or not. As we navigate the world of data science, one indispensable skill stands…

Connect Python with MS SQL Server Using Pandas: A Step-by-Step Guide by Consoleflare
Introduction In the world of data science and analytics, the ability to harness and manipulate data efficiently is paramount. Microsoft SQL Server is a powerful tool for database management, and Python, with its simplicity and versatility, is a favorite for data scientists. By connecting Python to SQL Server, professionals can leverage the strengths of both…
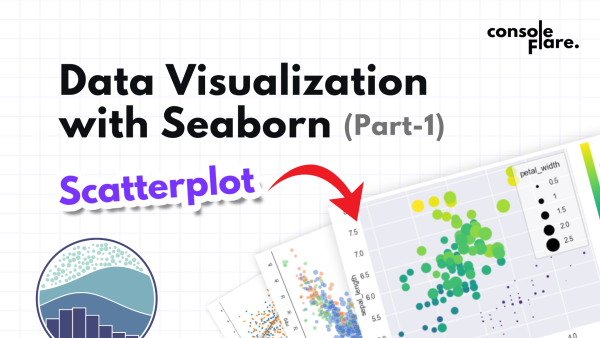
Data Visualization with Seaborn: 7 Steps Guide to Create Scatter Plot
In today’s world, data is more than just numbers—it’s a story waiting to be told. With tools like Python and Seaborn, you can transform raw data into visually appealing and insightful plots that help you make data-driven decisions. This blog walks you through a hands-on example of creating a professional scatter plot using Pandas, Seaborn,…

Files Oragnizer with Python: A Step-by-Step Guide to Automate File Management(10 steps)
Introduction Python offers an efficient solution to organize files as in today’s digital world, the files quickly pile up in our computers, ranging from images to documents, audio, and video files. Manually organizing these files into folders is time-consuming and repetitive, especially when we can leverage the power of the OS module of Python to…
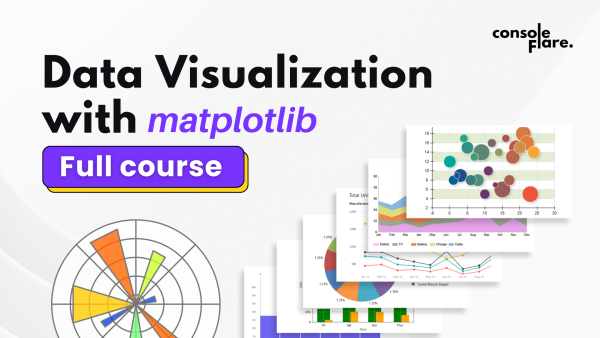
Matplotlib Full Tutorial: A Complete Guide to Data Visualization in Python
Load Data Before Practicing: Matplotlib for Data Visualization Learn how to create compelling data visualizations in Python with this Matplotlib full tutorial. From basics to advanced techniques, get started today. Matplotlib is a popular Python library for creating static, interactive, and animated visualizations. This tutorial covers the essential aspects of Matplotlib, with examples and code…
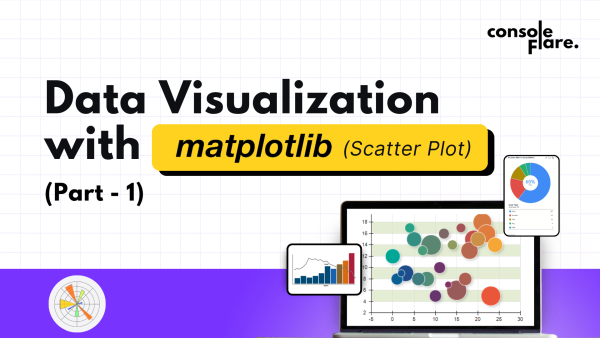
Data Visualization with matplotlib: Build Scatter Plot in 7 easy steps
In this blog post, we’ll walk through a simple data visualization example using Matplotlib in Python. We aim to create a scatter plot showing the relationship between the total bill and tip amounts from a dataset. This example will help you understand how to create meaningful visualizations step-by-step, adjust aesthetics like size and colors, and…
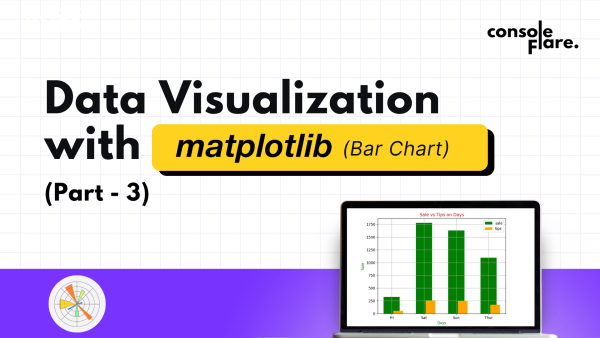
Data Visualization with matplotlib: Build Bar Chart in 6 easy steps
Data visualization is the graphical representation of information and data. It helps in identifying trends, patterns, and outliers that might go unnoticed in a plain data table. Bar charts, line graphs, histograms, and pie charts are some popular ways to visualize data. In Python, we use powerful libraries like Pandas and Matplotlib to: In the…
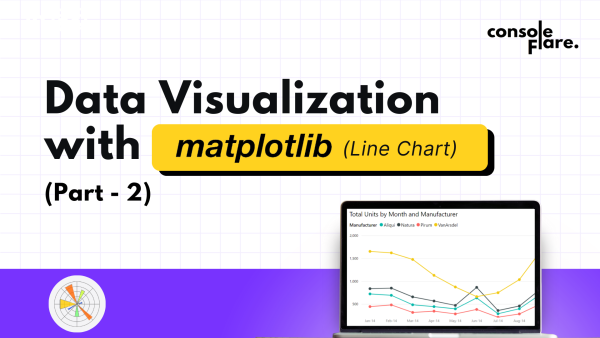
Data Visualization with matplotlib: Build Line Chart for Retail Sales Analysis in 7 easy steps
In this blog on data visualization, we will walk you through the process of reading and visualizing data using Python’s library Matplotlib for visualization. By the end of this tutorial, you’ll have a clear understanding of how to load data, create a comparison plot, and annotate the graph with important information. Data Visualization with matplotlib: Build…
Mastering Lookup Functions in Excel: HLOOKUP, XLOOKUP and VLOOKUP Excel
Understanding VLOOKUP Excel VLOOKUP, or Vertical Lookup, searches for a value in the first column of a table and returns a value in the same row from a column you specify. It’s perfect for searching vertically, where your key values are in a column to the left of the data you want to retrieve. Syntax:…